

War is 90 percent information.
Some studies show that about half of all Americans make decisions based on their “gut feeling”. Moreover, a lot of famous people are believed to heavily rely on their intuition. Some well-known and widely quoted examples are Albert Einstein saying, “The intuitive mind is a sacred gift," and Steve Jobs with his “Have the courage to follow your heart and intuition.”
In the era of global digital transformation, the role of data analysis in decision-making increases greatly. Still, today, according to Deloitte research, insight-driven companies are fewer in number than those not using an analytical approach to decision-making, even though the majority agrees on its importance. What's more, the MicroStrategy Global Analytics Study reports that access to data is extremely limited, taking 60 percent of employees hours or even days to get the information they need.
In this article, we will discuss how companies collect, manage, and get value out of their data, which technologies can be used in this process, and what problems can be solved with the help of analytics.
What is an analytics maturity model?
An analytics maturity model is a sequence of steps or stages that represent the evolution of the company in its ability to manage its internal and external data and use this data to inform business decisions. These models assess and describe how effectively companies use their resources to get value out of data. They also serve as a guide in the analytics transformation process.
Over the past decades, multiple analytics maturity models have been suggested. Some famous ones are:
- Gartner’s Maturity Model for Data and Analytics,
- DELTA Plus by Tom Davenport,
- DAMM - Data Analytics Maturity Model for Associations,
- SAS Analytic Maturity Scorecard, and many more.
To generalize and describe the basic maturity path of an organization, in this article we will use the model based on the most common one suggested by Gartner. We’ll also add no analytics level to contrast it with the first stage of analytical maturity.
Stages of analytics maturity
So, the path that companies follow in their analytical development can be broken down into 5 stages:
- No analytics refers to companies with no analytical processes whatsoever.
- Descriptive analytics lets us know what happened, gathering and visualizing historical data.
- Diagnostic analytics identifies patterns and dependencies in available data, explaining why something happened.
- Predictive analytics creates probable forecasts of what will happen in the future, using machine learning techniques to operate big data volumes.
- Prescriptive analytics provides optimization options, decision support, and insights on how to get the desired result.
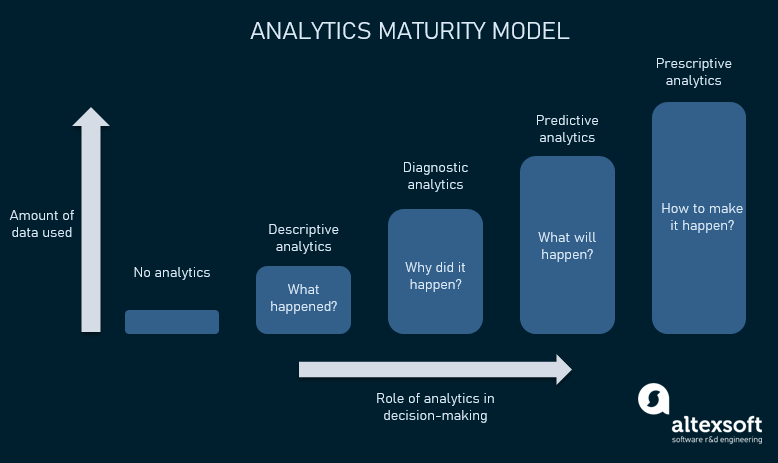
Analytics maturity model
Each of these stages is characterized by a certain approach to analytics. Different technologies and methods are used and different specialists are involved. But, of course, the transition is very gradual and sometimes the typical inherent peculiarities of one level are adopted by businesses at a different level. Also keep in mind that with achieving each new level, say, predictive analytics, the company doesn’t all of a sudden ditch other techniques that can be characterized as diagnostic or descriptive.
We will describe each level from the following perspectives:
- differences on the operational level,
- analytics tools companies use to manage and analyze data,
- business intelligence applications in real life,
- challenges to overcome and key changes that lead to transition.
Ground level of analytics
Hard to believe, but even now there are businesses that do not use technology and manage their operations with pen and paper. However, even at this basic level, data is collected and managed -- at least for accounting purposes.
At this stage, there is no analytical strategy or structure whatsoever. Data is collected to provide a better understanding of the reality, and in most cases, the only reports available are the ones reflecting financial results. Often, no technology is involved in data analysis. Reports are created in response to ad hoc requests from management. But decisions are mostly made based on intuition, experience, politics, market trends, or tradition.
The main challenge here is the absence of the vision and understanding of the value of analytics. In many cases, there is even no desire to put effort and resources into developing analytical capabilities, mostly due to the lack of knowledge. Changing the management’s mindset and attitude would be a great starting point on the way to analytics maturity.
Descriptive analytics
Today, most businesses use some kind of software to gather historical and statistical data and present it in a more understandable format; the decision-makers then try to interpret this data themselves.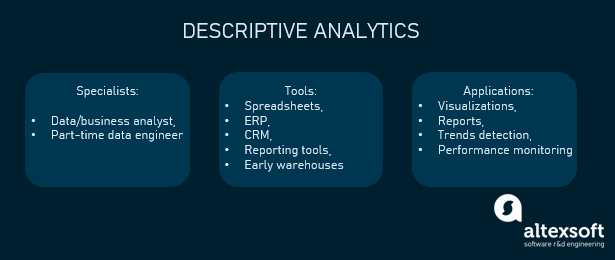
Descriptive analytics in a nutshell
Organizational perspective: No standards for data collection
Often, data is just pulled out manually from different sources without any standards for data collection or data quality. Some other common methods of gathering data include observation, case studies, surveys, etc.
Sometimes, a data or business analyst is employed to interpret available data, or a part-time data engineer is involved to manage the data architecture and customize the purchased software. Usually, there’s no dedicated engineering expertise; instead, existing software engineers are engaged in data engineering tasks as side projects.
At this stage, data is siloed, not accessible to most employees, and decisions are mostly not data-driven.
Technological perspective: First attempts at building data pipelines
Here, depending on the size and technological awareness of the company, data management can be conducted with the help of spreadsheets like Excel, simple enterprise resource systems (ERPs) and customer relationship management (CRM) systems, reporting tools, etc. These tools, besides providing visualizations, can describe available data, for example, estimate the frequency distribution, detect extreme and average values, measure dispersions, and so on. Data is mostly analyzed inside its sources.
That said, technologies are underused. While allowing for collecting and organizing data, no deep investigation is available. So, analytics consumers don’t get explanations or reasons for what’s happening.
At this point, some organizations start transitioning to dedicated data infrastructure and try to centralize data collection. The key artifact of this centralization is data warehouses that can be created as part of an ETL data pipeline.
Check our detailed article to find out more about data engineering or watch an explainer video:

Data engineering, explained
In a nutshell, a data warehouse is a central repository where data from various data sources (like spreadsheets, CRMs, and ERPs) is organized and stored. Also, at the descriptive stage, the companies can start adopting business intelligence (BI) tools or dashboard interfaces to access the data centralized in a warehouse and explore it.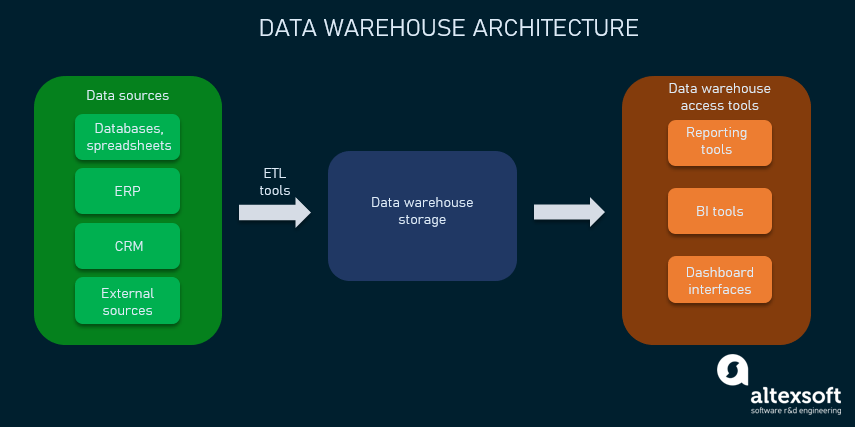
Data warehouse architecture
Real-life applications: Data for reporting and visualizations
Descriptive analytics helps visualize historical data and identify trends, such as seasonal sales increases, warehouse stock-outs, revenue dynamics, etc. It allows companies to find out what their key competitive advantage is, what product or channel performs best, or who their main customers are. It’s also the core of all the regular reports for any company, such as tax and financial statements.
Analytics and technologies can also benefit, for example, educational institutions. Here’s an interesting case study of Portland State University implementing IBM Cognos Analytics for optimizing campus management and gaining multiple reports possibilities.
Key changes for making a transition to diagnostic analytics
Building a data-centered culture. Here, the main issues to overcome concern the company structure and culture. Breaking silos between departments and explaining the importance of analytics to employees would allow for further centralizing of analytics and making insights available to everyone. Given the company has a vision for further analytics growth, it must decide on the driver that will be promoting the data culture across the organization.
Introducing data engineering and data science expertise. Data engineering is required for building data infrastructure. At this point, organizations must either train existing engineers for data tasks or hire experienced ones. Also, the skill set of the business analyst is not enough for running complex analytics, so companies have to think about engaging data scientists.
Enhancing infrastructure. Companies at the descriptive analytics stage are still evolving and improving their data infrastructure. This entails testing and reiterating different warehouse designs, adding new sources of data, setting up ETL processes, and implementing BI across the organization.
Introducing systematic diagnostic analysis. Data analysts and data scientists may create some diagnostic and predictive reports on demand. For further transition, the diagnostic analysis must become systematic and be reflected both in processes and in at least partial automation of such work.
Diagnostic analytics
Diagnostic analytics is often thought of as traditional analytics, when collected data is systematized, analyzed, and interpreted. At this stage, technology is used to detect dependencies and regularities between different variables. The term data mining describes this process of discovering patterns and extracting valuable information from large volumes of data for further use.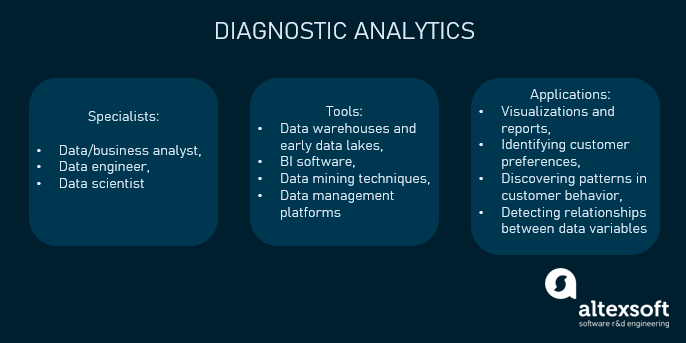
Diagnostic analytics in a nutshell
Organizational perspective: Data scientist for interpreting data
This is the stage when companies start to realize the value of analytics and involve technologies to interpret available data more accurately and efficiently to improve decision-making processes. Multiple KPIs are created and tracked consistently. Often, investments are made to acquire more comprehensive software and hire a data scientist to manage available data and extract knowledge from it using data mining techniques.
However, in many cases, analytics is still reactive and comes as a result of a specific request. The data is then rarely shared across the departments and only used by the management team. Decisions are often delayed as it takes time to analyze existing trends and take action based on what worked in the past.
Technological perspective: BI tools with data mining techniques
The overall BI architecture doesn’t differ a lot from the previous stage. In some cases, a data lake -- a repository of raw, unstructured or semi-structured data -- can be added to the pipeline. Lakes become one of the key tools for data scientists exploring the raw data to start building predictive models.
Besides using the advanced versions of the technology described above, more sophisticated BI tools can be implemented. They typically involve online analytical processing (OLAP), which is the technology that allows for analyzing multidimensional data from numerous systems simultaneously. Besides OLAP, data mining techniques are used to identify the relationships between numerous variables. Most common data mining approaches include:
- classification -- categorizing different types of data;
- clustering -- grouping data pieces according to certain similarities;
- association or correlation -- finding connections and links between certain variables;
- pattern detection -- identifying trends and regularities over a certain period;
- regression -- analyzing the relationship between variables and the likelihood of the possible forecasted outcomes;
- outer detection or outlier analysis -- detecting and observing anomalies or items that do not match the expected pattern;
- prediction -- forecasting future events (at this point, predictions are simple, based on existing trends and patterns, and less accurate than the ones made at the next stages of analytical development).
Some of the most popular BI end-to-end software are Microsoft Power BI, Tableau, and Qlik Sense. They allow for easier collection of data from multiple sources and through different channels, structuring it, and presenting in a convenient visual way via reports and dashboards. Besides, creating your own customized platform is always another option. Check our dedicated article about BI tools to learn more about these two main approaches.
Besides specialized tools, analytics functionality is usually included as part of other operational and management software such as already mentioned ERP and CRM, property management systems in hotels, logistics management systems for supply chains, inventory management systems for commerce, and so on. All of them allow for creating visualizations and reports that reflect the dynamics of the main company metrics. Though some of them also have forecasting functionality, they can only predict how the existing trends would continue.
Real-life applications: Finding dependencies and reasoning behind data
At the diagnostic stage, data mining helps companies, for example, to identify the reasons behind the changes in website traffic or sales trends or to find hidden relationships between, say, the response of different consumer groups to advertising campaigns.
It’s also a potent retail marketing tool as it allows for identifying customers’ preferences and acting accordingly by changing the layout of products on the shelves or offering discounts and coupons.
Besides commerce, data mining techniques are used, for example, in healthcare settings -- for measuring treatment effectiveness.
Check the case study of Orby TV implementing BI technologies and creating a complex analytical platform to manage their data and support their decision making. Here’s another one of a multibusiness company that aggregated data from multiple applications to gain a 360-degree customer view and robust retail analytics.
Key changes for making a transition to predictive analytics
Democratizing access to data. At this point, to move forward, companies have to focus on optimizing their existing structure to make data easily accessible. This requires training of non-technical employees to query and interact with data via available tools (BI, consoles, data repositories). This also means that employees must be able to choose the data access tools that they are comfortable about working with and ask for the integration of these tools into the existing pipelines.
Productionizing machine learning. Also, instead of merely reacting to changes, decision-makers must predict and anticipate future events and outcomes. For that, data architecture has to be augmented by machine learning technologies, supported by data engineers and ML engineers. This requires significant investment in ML platforms, automation of training new models, and retraining the existing ones in production.
Automating predictive analysis. While most organizations that use diagnostic analysis already have some form of predictive capabilities, machine learning infrastructure allows for automated forecasting of the key business metrics.
Predictive analytics
Providing forecasts is the main goal of predictive analytics. Advanced technological tools assess opportunities and risks and allow for identifying the likelihood of future outcomes. Big volumes of both historical and current data out of various sources are processed to create models, simulations, and predictions, detect trends, and provide insights for more accurate and effective business decisions.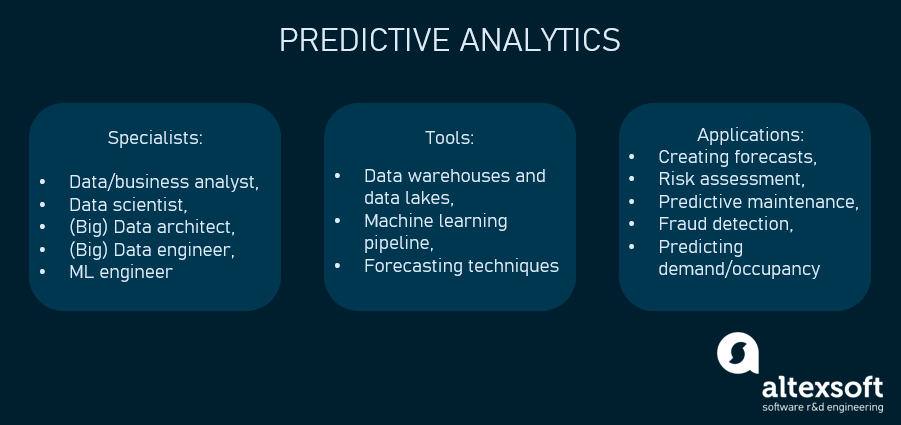
Predictive analytics in a nutshell
Organizational perspective: Data science teams to conduct data analysis
At this stage, analytics becomes enterprise-wide and gains higher priority. Employees are granted access to reliable, high-quality data and can build reports for themselves using self-service platforms. Decision-making is based on data analytics while performance and results are constantly tracked for further improvement. Reports are replaced with interactive analytics tools.
Usually, a team of data scientists is required to operate all the complex technologies and manage the company’s data in the most efficient way.
Roles in data science teams
The data science teams can be integrated with the existing company structure in different ways. Accenture offers a number of models based on governance type, analysts location, and project management support. Typically, at this stage, organizations either create a separate data science team that provides analytics for various departments and projects or embeds a data scientist into different cross-functional teams.
Technological perspective: Machine learning techniques and big data
At this level, analytics is becoming largely automated and requires significant investment for implementing more powerful technologies. Here, the major data science concepts such as big data, artificial intelligence (AI), and machine learning (ML) are introduced as they become the basis for predictive technologies.
Big data. Data is collected from all possible channels, i.e., Internet of Things (IoT), databases, website analytics tools, social media, and other online sources, and then stored in data lakes or other storages. Since some portion of this data is generated continuously, it requires creation of a streaming data architecture, and, in turn, makes real-time analytics possible. To capture valuable insights from big data, distributed computing and parallel processing principles are used that allow for fast and effective analysis of large data sets on many machines simultaneously.
ML infrastructure. At the predictive stage, the data architecture becomes more complex. A lot of data sources are integrated, providing raw data of multiple types -- to be cleaned, structured, centralized, and then retrieved in a convenient format. The previous BI pipeline is not enough and is enhanced by the ML pipeline that is created and managed by ML engineers. This pipeline is all about automating the workflow and supports the entire machine learning process, including creating ML models; training and testing them; collecting, preparing, and analyzing incoming data; retraining the models; and so on.
When considering the implementation of the ML pipeline, companies have to take into account the related infrastructure, which implies not only employing a team of data science professionals, but also preparing the hardware, enhancing network and storage infrastructure, addressing security issues, and more.
A most popular and well-known provider of predictive analytics software is SAS, having around 30 percent market share in advanced analytics. It’s based on powerful forecasting techniques, allowing for creating models and testing “what-if” scenarios to determine the impact of various decisions.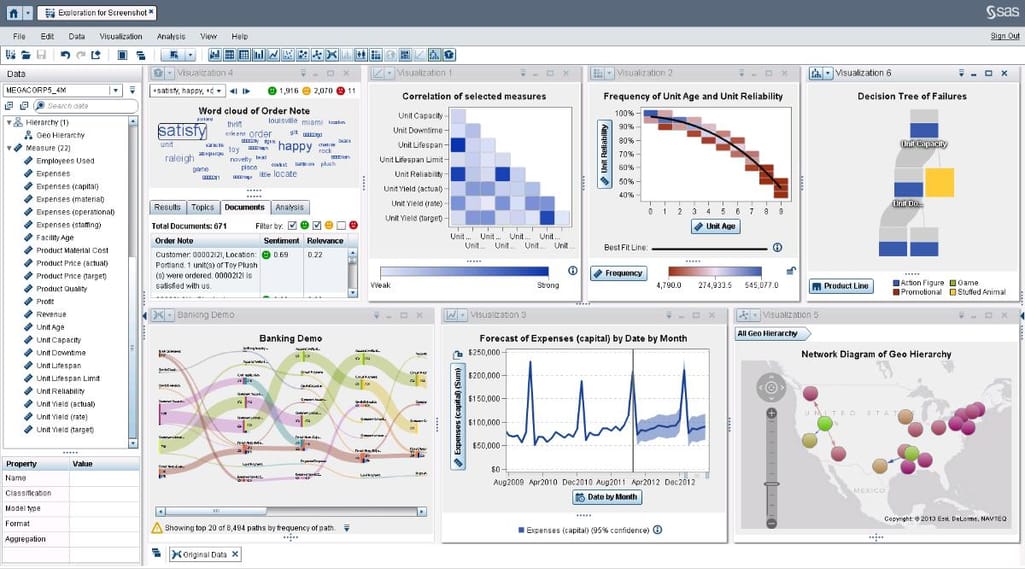
SAS predictive analytics interface
Real-life applications: Data for forecasting in multiple areas
Machine learning and big data provide broad analytical possibilities. Today, ML algorithms are used for analyzing customer behavior with marketing purposes, customer churn prediction for subscription-based businesses, product development and predictive maintenance in manufacturing, fraud detection in financial institutions, occupancy and demand prediction in travel and hospitality, forecasting disease spikes in healthcare, and many more. They’re even used in professional sports to predict the championship outcome or who’s going to be the next season's superstar.
Here are some real examples: the sports retailer predicting demand using weather and traffic data; PayPal discovering the customers’ intentions by analyzing feedback; the vacation timeshare exchange industry leader addressing members’ attrition; and the educational information portal increasing the advertisements response rate.
Key changes for making a transition to prescriptive analytics
Enterprise-wide data governance and quality management. Relying on automated decision-making means that organizations must have advanced data quality measures, established data management, and centralized governance.
Introducing MLOps and DataOps. Given the advanced nature of data and machine learning pipelines, MLOps and DataOps practices bring test automation and version control to data infrastructure, similar to the way it works with DevOps in traditional software engineering. It allows for rapid development of the data platform.
Automation and optimization of decision making. To get to the topmost stage of analytics maturity, companies have to maximize the automation of decision-making processes and make analytics the basis for innovations and overall development. This doesn’t mean that the most complex decisions are automated. Optimization may happen in manual work or well-established operations (e.g., insurance claims processing, scheduling machinery maintenance, and so on).
Prescriptive analytics
At its highest level, analytics goes beyond predictive modeling to automatically prescribe the best course of action and suggest optimization options based on the huge amounts of historical data, real-time data feeds, and information about the outcomes of decisions made in the past.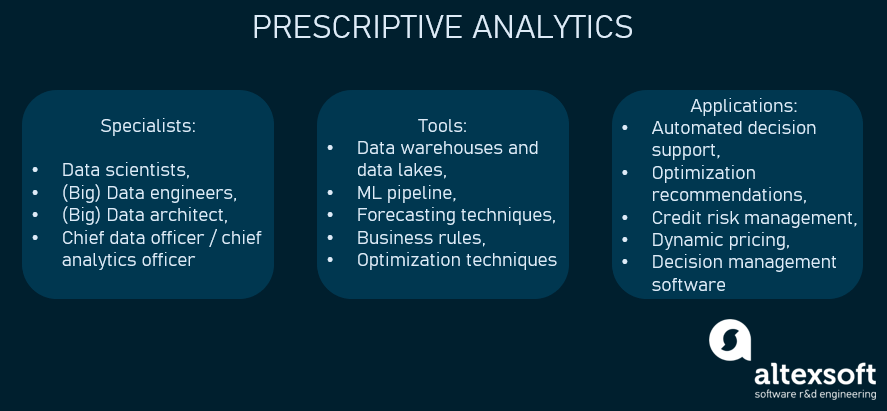
Prescriptive analytics in a nutshell
Organizational perspective: Data specialists in the CEO suite
Analytics becomes fully automated and provides decision support by giving recommendations on what actions have to be taken to achieve the desired results. Company strategy and development as well as innovation projects are based on data analytics.
Besides the mentioned-above teams of data scientists and big data engineers that work on support and further development of data architecture, in many cases, there is also a need for new positions related to data analytics, such as CAO (Chief Analytics Officer) or Chief Digital Officer, Chief Data Officer (CDO), and Chief Information Officer (CIO).
Technological perspective: Optimization techniques and decision management technology
The structure of data architecture doesn’t differ much compared to the previous stage. However, more complex methods and techniques are used to define the “next best action” based on the available forecasts. Since optimization lies at the heart of prescriptive analytics, every little factor that can possibly influence the outcome is included in the prescriptive model. So, besides using the data mining methods together with ML and rule-based algorithms, other techniques include:
- Simulation and scenario analysis -- an imitation of real-world situation made to test new ideas and how changes will influence an existing system or process;
- Complex event processing -- a method of combining streaming data from different sources and analyzing it in real time;
- Mathematical optimization -- a set of techniques to find an optimal solution to a problem with certain numerical constraints.
There is a variety of end-to-end software solutions that offer decision automation and decision support. Examples of such tools are: ACTICO, Llamasoft, FlexRule, Scorto Decision Manager, and Luminate.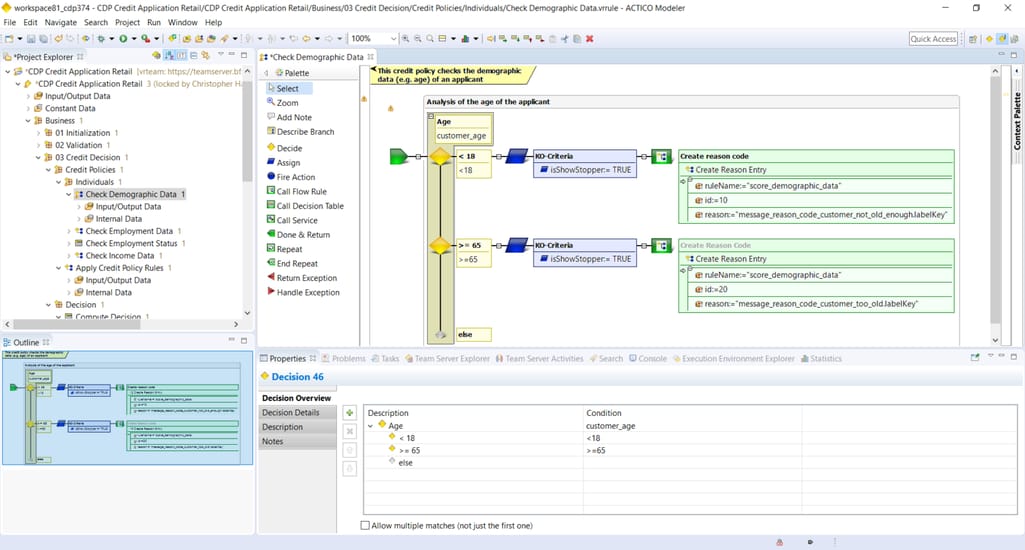
ACTICO Credit decisioning interface
Real-life applications: Automated decisions streamlining operations
Besides the obvious and well-known implementation in marketing for targeted advertising, advanced loyalty programs, highly personalized recommendations, and overall marketing strategy, the benefits of prescriptive analytics are widely used in other fields. In the financial industry, automated decision support helps with credit risk management, in the oil and gas industry with identifying best locations to drill and optimizing equipment usage, in warehousing with inventory level management, in logistics with route planning, in travel with dynamic pricing, in healthcare with hospital management, and so on.
Nowadays, prescriptive analytics technologies are able to address such global social problems as climate change, disease prevention, and wildlife protection.
When you think of prescriptive analytics examples, you might first remember such giants as Amazon and Netflix with their customer-facing analytics and powerful recommendation engines. Here are some other case studies of how advanced technologies and decision automation can benefit businesses: Ernsting’s family managing pricing, Australian brewery planning distribution, and Globus CR optimizing promotion strategy.
Key challenges
At this stage, the main challenges that a company faces are not related to further development, but rather to maintaining and optimizing their analytics infrastructure. As research shows, the major problems related to big data include data privacy, lack of knowledge and specialists, data security, etc. So, at this point, companies should mostly focus on developing their expertise in data science and engineering, protecting customer private data, and ensuring security of their intellectual property.
Steps to consider for improving your analytics maturity
It is obvious that analytics plays a key role in decision-making and a company’s overall development. Here are some actionable steps to improve your company’s analytics maturity and use data more efficiently.
Assess your current analytics maturity level. Find out what data is used, what are its sources, what technical tools are utilized, and who has access to it.
Research what other sources of data are available, both internally and externally. Create and track KPIs to monitor performance, encourage and collect customer feedback, use website analytics tools, etc. Measuring the outcomes of any decisions and changes that were made is also important.
Consider the metrics that you monitor and what questions they answer. Instead of focusing on metrics that only give information about “how many”, prioritize the ones that give you actionable insights about “why” and “how”. That can help you understand the reasons for business processes and customer behavior, make predictions, and act accordingly.
Ensure that all stakeholders have access to relevant data. You might want to implement some agility practices to break down the silos and simplify data sharing across departments. Consider giving employees access to data. Teach them how to use it and encourage generation of new ideas.
Invest in technology that can help you interpret available data and get value out of it, considering the end-users of such analytics. For example, if it is the non-technical staff, it’s worth going for data visualization tools with a user-friendly interface to make reports easy to understand.
Make sure that new technologies and capabilities are embedded in your existing processes and combined with the existing institutional knowledge.
When properly analyzed and used, data can provide an unbeatable competitive advantage, allowing for better understanding of your clients, faster and more accurate reactions to market changes, and uncovering new development opportunities.

Maria is a curious researcher, passionate about discovering how technologies change the world. She started her career in logistics but has dedicated the last five years to exploring travel tech, large travel businesses, and product management best practices.
Want to write an article for our blog? Read our requirements and guidelines to become a contributor.