

In our blog, we’ve been talking a lot about the importance of business intelligence (BI), data analytics, and data-driven culture for any company. Multiple studies continuously demonstrate the superiority of analytics-based organizations (e.g., Deloitte calculated that companies with data-driven CEOs are 77 percent more likely to succeed) and in today’s business world it’s absolutely self-evident that data is the key to success.
In spite of all that, other research indicates that 87 percent of companies are still at a low level of analytics maturity – often because of merely not knowing where to start. One of the important steps away from spreadsheets and towards developing your BI capabilities is choosing and implementing specialized technology to support your analytics endeavors. So, in this article, we’ll talk about the current BI market leader – Microsoft Power BI – and discuss its functionality, pros and cons, and alternatives.
What is Power BI?
Microsoft Power BI is an interactive data visualization software suite developed by Microsoft that helps businesses aggregate, organize, and analyze data. Users can easily create a wide range of data-intensive, yet intelligible, reports and dashboards and share acquired insights.
It was recognized as the 2022 Gartner Magic Quadrant leader among analytics and business intelligence platforms – for the 5th consecutive year.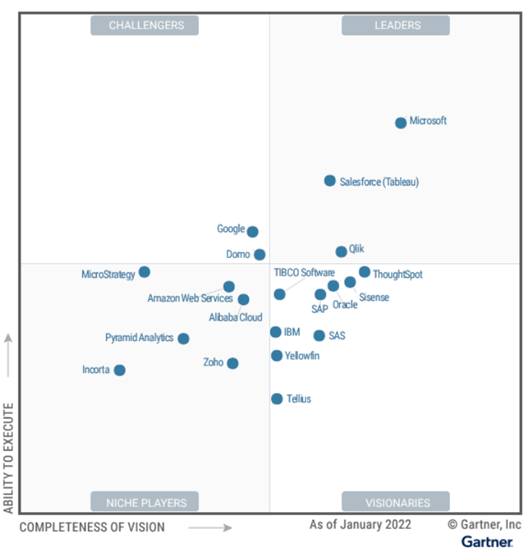
Gartner’s 2022 Magic Quadrant for Analytics and Business Intelligence Platforms
What is Power BI used for?
Power BI helps arrange disparate data from multiple sources and make it understandable for end users. Following the current market trend, Power BI puts an emphasis on self-service which means shifting access to information and insights from professional data analysts to end consumers, average employees, and decision-makers alike.
That’s why any business in any industry can benefit from using the platform – from small mom-and-pops that only need data visualization and basic reporting to enterprise corporations that process large masses of data across multiple departments.
For example, the sales teams can scrutinize their turnover and suppliers, run trend analysis, and reveal growth opportunities. Marketing departments can track how successfully their campaigns perform, predict customer churn, and conduct sentiment analysis. Executives and managers can use the platform to monitor the overall company performance, discover important market trends, and run what-if scenarios to make the most effective strategic decisions.
Power BI products
Microsoft Power BI is actually an umbrella term that’s used for a suite of analytics products.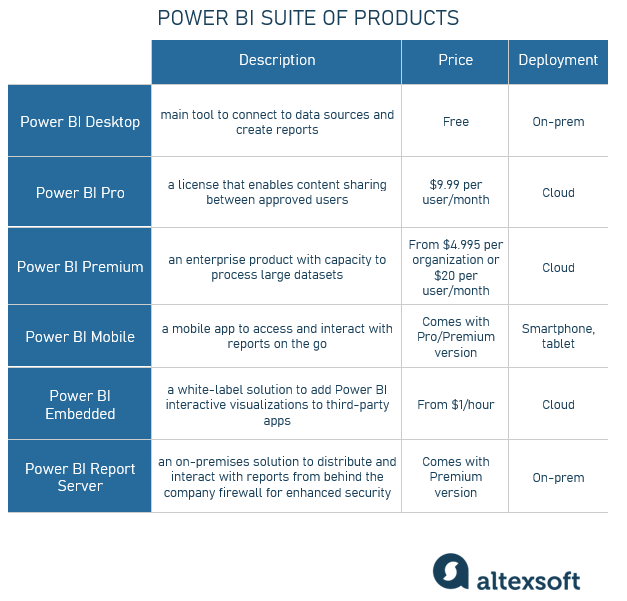
Power BI products
Power BI Desktop is a free, downloadable app that’s included in all Office 365 Plans, so all you need to do is sign up, connect to data sources, and start creating your interactive, customizable reports using a drag-and-drop canvas and hundreds of data visuals. You get 10GB of cloud storage and can upload 1GB of data at a time. It’s a great option for small businesses that can get a robust BI tool with rich functionality – at no cost.
Power BI Pro and Power BI Premium (these are sometimes referred to as Power BI Service) are more feature-rich, paid services hosted on the Microsoft Azure cloud.
Power BI Pro offers you similar functionality and storage space to the Desktop version plus a few extras like sharing your content with others privately or creating app workspaces. The Pro version pricing is on a per-user basis ($9.99 per user/month).
The Premium version gives you access to AI-generated insights (text analytics, image detection, and automated machine learning), self-service data preparation capabilities, and simplified data management. You can create and manage data marts and also have the Power BI Report Server tool included for on-premises reporting (more about it below). This product is mainly for enterprises with many users that need to collaborate in real time.
For a Premium license, you either pay $20 per user/month or choose one of the capacity models and pay from $4,995 per month. Basically, you’re buying an exclusive use of computing power (in the form of virtual CPU cores and memory) to process your BI workloads, with Microsoft supplying and supporting all the necessary infrastructure. It’s also important to understand that Power BI Premium has to be obtained with Power BI Pro per-user licenses as they only work together.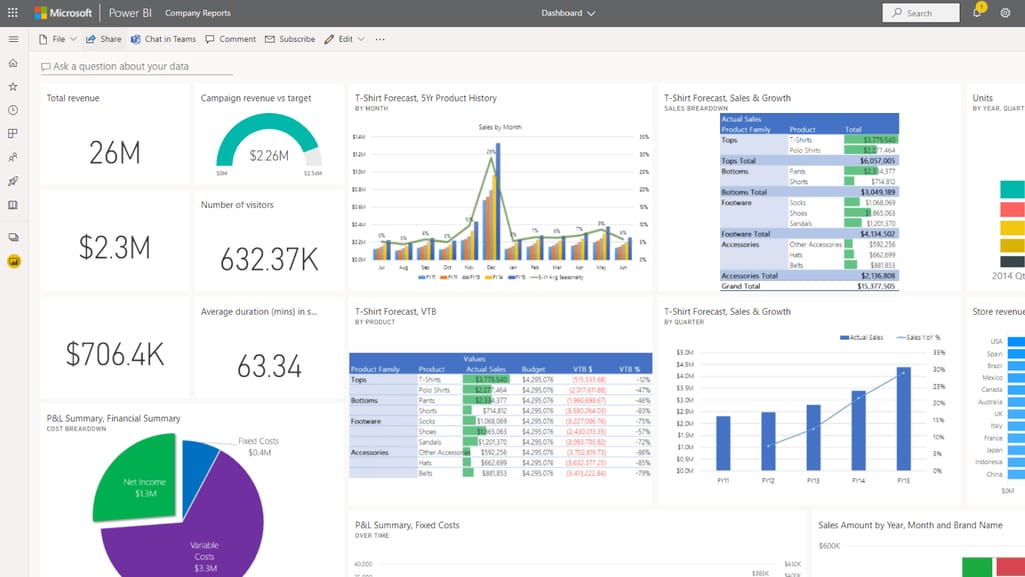
Power BI interface
Power BI Mobile is just what it sounds like – a mobile application (developed natively for Windows, iOS, and Android) that allows you to get access to all your reports and dashboards created in Power BI Desktop, Power BI Pro/Premium, and even on-premises Power BI Report Server content. You can create, annotate, and share reports, submit natural language queries, and set up personal data alerts.
Power BI Embedded is a white label solution that works on a pay-as-you-go model (starting from $1/hour). It enables third-party app developers to embed the visualizations created with Power BI into their products. This way, end-users get access to rich visualization and analytical capabilities that’s included into another app or website interface.
To create the Power BI embedded capacity, you need at least one account with Power BI and an Azure subscription in your organizational directory. Here’s the documentation for developers with detailed descriptions and instructions.
Power BI Report Server is the on-premises reporting solution “with the flexibility to move to the cloud.” It is part of Power BI Premium designed mainly for those organizations that deal with sensitive data and need to manage it on their own server.
Users can create reports with Power BI Desktop and then publish them to the Report Server to distribute them among approved users. Note though, that this product comes with a number of limitations (no dashboards, no alerts, no in-Excel analytics, no content packs, no opportunity to create reports in the browser, no real-time streaming analytics, etc.).
Power BI tools
If we take a look under the hood, Power BI consists of several main components.
- Power Query is essentially an ETL tool – a connectivity solution for data import and preparation.
- Power Pivot is a powerful calculation engine and data modeling instrument.
- Power View handles data visualizations.
- Power Map is a 3-D geospatial visualization tool that helps users see information at another angle.
- Power Q&A allows you to explore your data in your own words by asking a question using natural language.
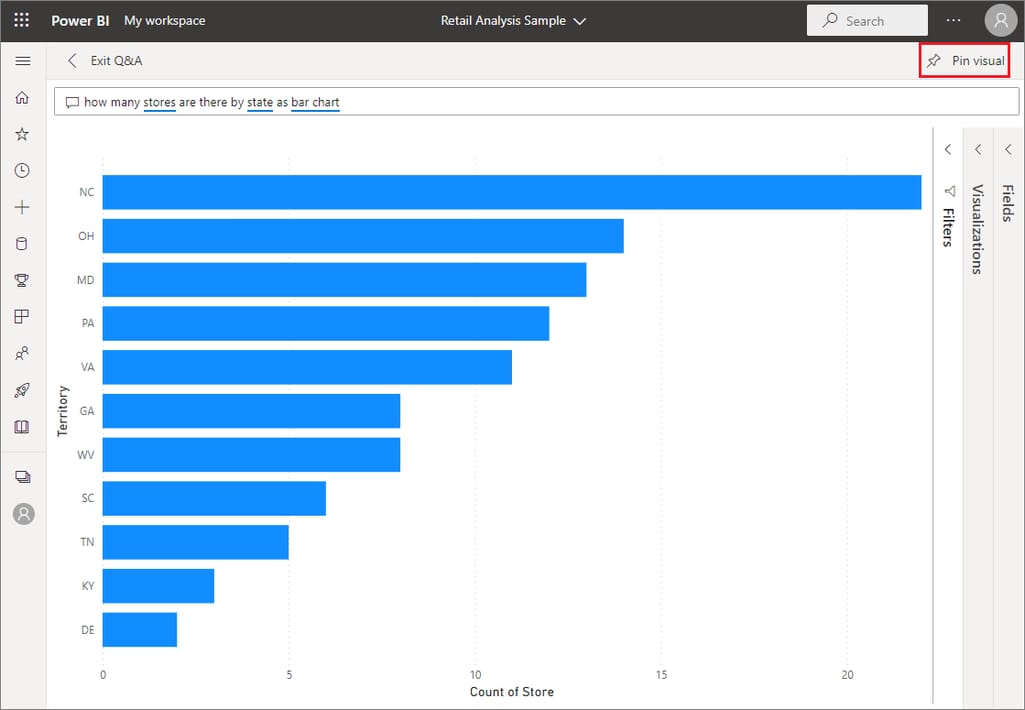
Q&A in Power BI
Power BI is a powerful, multi-featured tool, but of course, just like anything in this world, it’s not perfect. So let’s talk about the goods and the bads.
Pros of Power BI
It goes without saying that Power BI has a lot of great perks, making it the tool of choice for many companies on their way to higher analytics maturity. Let’s see what they are.
Wide range of visualizations and customization options
Power BI offers a range of visualization options that allow you to view your data from every possible side. There are several main categories of visuals according to their purpose:
- comparison, (e.g., bar/line/area charts, treemaps),
- correlation (e.g., scatter charts, column lines),
- distribution (e.g., bubble charts, grouped bars),
- data over time (e.g., bar/line/area charts, waterfalls),
- part-to-whole (e.g., donuts, stacked bard), and
- ranking (e.g., funnels, ribbons, decomposition trees, ordered bars/columns).
Other standard visuals include matrices to cross-highlight data, gauges to monitor progress, maps to track geographic distribution, etc.
Plus, there are tons of customization opportunities. You can personalize dashboards and interfaces, create custom reports and visualizations, and even set up alerts on specific KPIs to notify your team of important metrics updates.
Power BI also provides a visuals SDK to create custom visualizations based on such popular JavaScript libraries as D3 or jQuery. Some of the top Power BI custom visuals are Gantt charts, slicers, radar charts, linear gauges, chord charts, and others.
A chord chart. Explore more at Power BI sample visuals
Support for multiple data sources and formats
What you need to obtain valuable insights is data – the more the better. So, Power BI’s ability to connect to numerous data sources and retrieve information in a variety of formats is one of the platform’s biggest advantages. Power BI data sources include
- Excel Workbook, text/CSV, JSON, PDF, XML, SharePoint Folder files, and folders;
- databases (IBM Netezza, MySQL, Teradata, PostgreSQL, etc.) and data warehouses (SAP Business Warehouse Server, Snowflake, Google BigQuery, Redshift, etc.);
- Microsoft Power Platform (Power BI datasets and dataflows);
- Microsoft Azure services; and
- online services (Dynamics 365, Salesforce Objects/Reports, Google Analytics, Adobe Analytics, etc.).
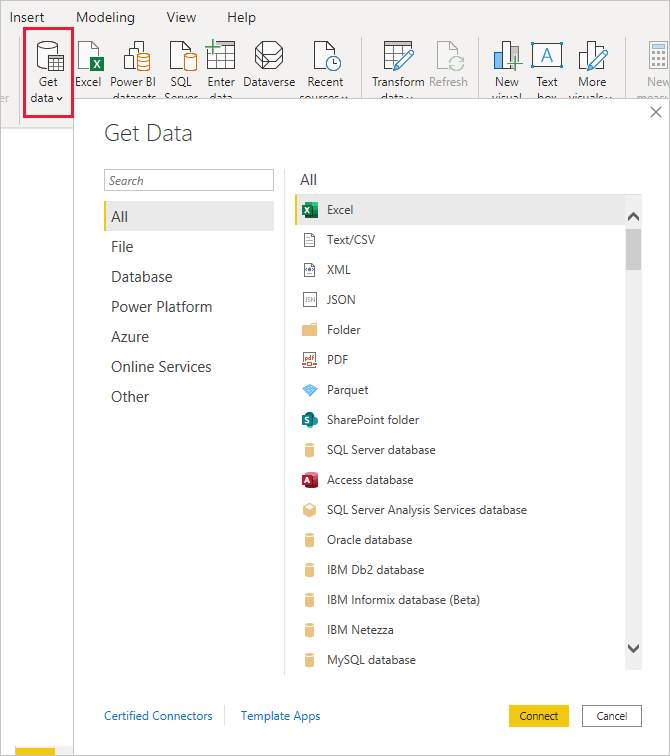
Power BI data sources
There are over 300 out-of-the-box data connectors provided by Power BI. You can also create custom data connectors (check the dedicated GitHub page) by building an API integration. Microsoft keeps expanding the list of available data sources so you’ll see early versions of new connectors marked as Beta or Preview. They have limited support and functionality but are in progress for full release.
Once you have your data sources connected, a Power Query Editor tool will help you transform data, add/remove/split columns, change data types, check for errors, and perform other interactions. Note though that sometimes you can get too much information when you set up a data connection. In that case, you’ll have to either manually select the data you need or establish a custom integration to retrieve the required information.
As for keeping your Power BI content up to date, an auto-update feature allows you to easily insert new information from the source file into your Power BI report or configure a scheduled refresh. If you deal with streaming data, you can set up real-time monitoring via Power BI dashboards.
ML capabilities
Power BI allows you to take advantage of ML techniques to perform sentiment analysis, generate forecasts, detect languages, tag images, and much more. You can
- analyze structured and unstructured data;
- build, train, and deploy ML models (binary, classification, regression);
- recognize patterns and dependencies to build predictions;
- run what-if scenarios, and so on.
Power BI comes pre-integrated with Azure Cognitive Services such as Auto ML, which allows users to quickly configure ML capabilities and apply it to data. Note that it’s only available for dataflows hosted on Power BI Premium and Embedded capacities. You can read more about AI in dataflows in Power BI documentation.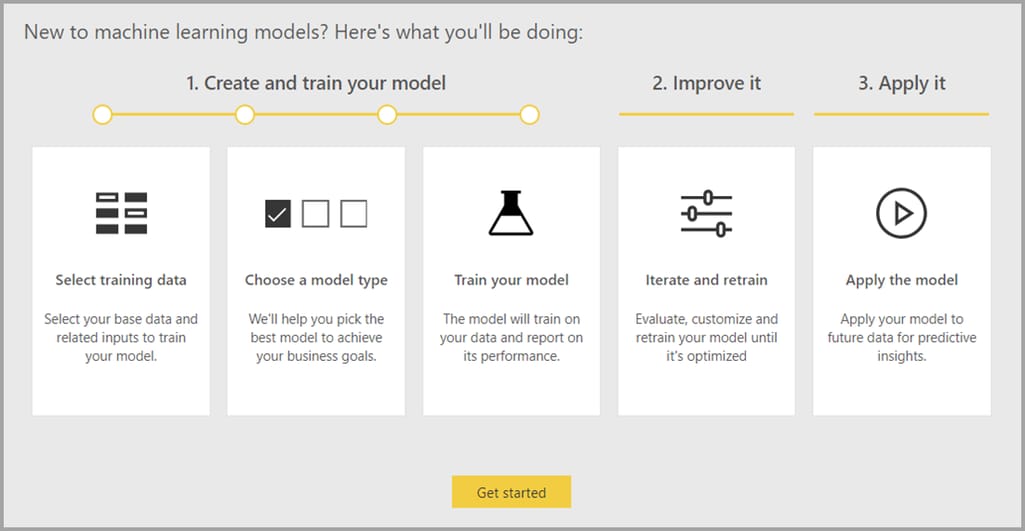
AutoML in a nutshell
Native R integration
In addition to Microsoft and third-party products, Power BI is natively integrated with R – a programming language for statistical computing and graphics. Thanks to that, you can import R-based visualizations directly into a standard Power BI dashboard, run R scripts, include datasets in the data model, and more.
Top security
Information is an extremely valuable asset so its security is a top priority for most companies, especially those dealing with sensitive or personal data and having to protect it to comply with laws and government regulations. Power BI gives you a handful of reasons to rest assured your cloud-stored data is safe (if you want details, read more about it in their security whitepaper).
- First of all, Microsoft has one of the most advanced security stacks in the tech industry, with its end-to-end data encryption and multilayer protection against malicious actors and other cloud-related vulnerabilities.
- To avoid exposure to the public internet, you can use Azure services (Azure Private Link, Azure Virtual Network, etc.).
- You can oversee sensitive data through BYOK (bring your own key) that gives you control over the encryption keys.
- As part of Microsoft Trust Center, Power BI is compliant with more than 100 standards and certifications (e.g., IL6, FedRAMP, HIPAA, and FINRA).
- You can manage user access and monitor behavior patterns to detect and analyze the risky ones. You can also set up strong permission controls and network isolation.
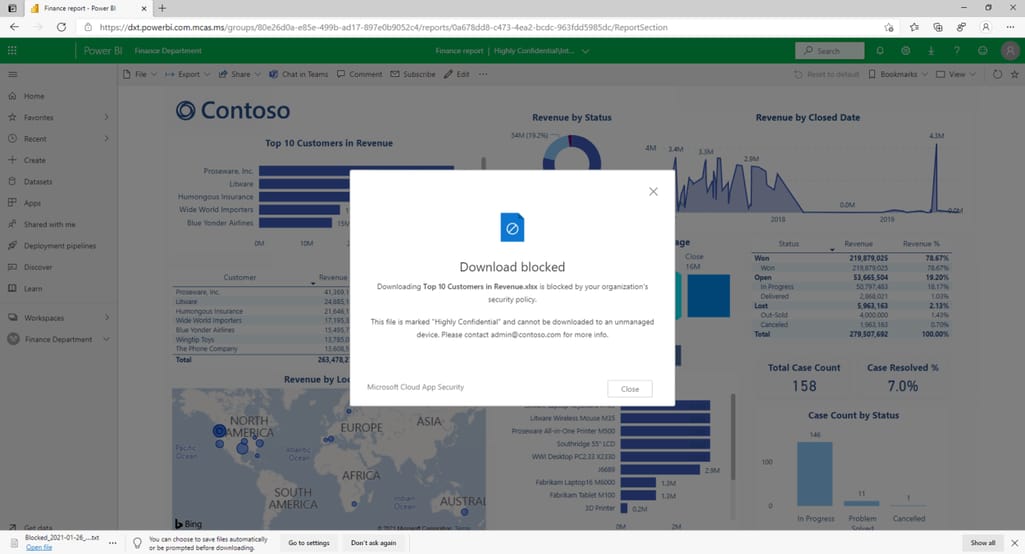
Power BI security alert
If that’s not enough and you feel you trust your server more than the cloud storage, you can always go with the on-premises Power BI Report Server and work from behind your firewall.
Detailed documentation
Microsoft has a comprehensive Power BI documentation portal with explainers and tutorials for all the features and capabilities. There’s also a vast online knowledge base with descriptions, tips, how-to guides, and best practices. So whether you’re a newbie who’s just starting to get acquainted with the new product or an expert figuring out another advanced feature, you’re likely to get an answer from Microsoft official docs.
Large Power BI community
If the information you’re looking for is not in the docs, don’t panic. Power BI has a massive community worldwide with 850k+ active members. If you want to ask a question about the product, complain about issues, share your knowledge with others, leave feedback, or discuss anything related to Power BI, it’ll be easy for you to find interlocutors. There’s also a collection of training webinars, a tips and tricks section, and news about upcoming events.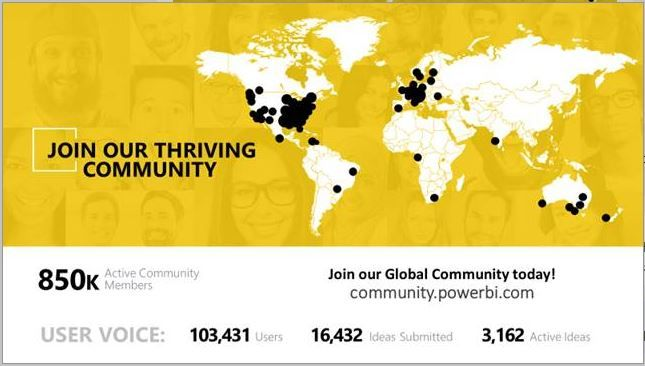
Power BI community stats as of 2019
Besides the official community page, you can get information and answers from Power BI experts on StackOverflow. There are 15k+ related questions (vs around 6k for Tableau or 1k for QlikView). Other platforms to browse for assistance include YouTube (their channel has 323k subscribers), Twitter (with 151k+ subscribers of the official account), LinkedIn, Quora, Reddit, you name it.
Power BI pricing: free trial and affordable cost
As we said, there’s a Power BI Desktop version completely free of charge for smaller companies or those who want to check it out before deciding on the subscription. We also spoke about the paid versions pricing but we didn’t mention that Microsoft offers a generous 60-day trial period of Power BI Pro to test the waters before committing to deploy it across the entire organization.
And even when you decide you want to purchase the subscription, its cost is generally more affordable than that of its nearest competitors.
Microsoft backing
As we said, Microsoft keeps working on developing and improving its product. It adds new features so that users can take advantage of the latest, most advanced technologies. Community members have an opportunity to suggest ideas on how to make it better. The idea with the highest rating is likely to be considered and included in the next updates – that come out pretty often. Here’s the ideas portal where you can add and/or vote.
Plus, Power BI is a part of Microsoft Power Platform. Microsoft Power Platform is a set of applications that allow you to easily build solutions and websites, automate processes, analyze data (that’s what Power BI is responsible for), and create virtual agents (aka chatbots). On top of that, there are hundreds of data connectors to enable data flow from different sources we listed above, an AI builder to add a drop of predictive magic, and a seamlessly integrated Microsoft Office 365.
With such a toolset, you can develop business solutions to support your workflows – with powerful analytics capabilities included.
There are more good things to say about Power BI like
- both cloud and on-premises storage options,
- mobile access,
- simple sharing options plus easy export to Excel and PowerPoint,
- embedding opportunities,
- natural language query engine and Cortana integration for easy verbal operation, and so on.
But now it’s time to switch to the dark side.
Cons of Power BI
As we said, Power BI is great but it’s still far from being a silver bullet. There are a number of drawbacks that allow its competitors to thrive.
Complexity and substantial learning curve
Many users assert that Power BI boasts a simple, intuitive interface that can be mastered by literally anyone familiar with a screen, a keypad, and a mouse. No coding skills, technical experience, or PhD in data science is needed. But. It all depends on what you want to do within Power BI. Once you take a couple of steps away from standard visualizations in Excel, you’re most likely to encounter multiple challenges with all sorts of pitfalls and quirks.
Integrating, preparing, and modeling data (especially from multiple sources) takes skill and experience. So to harness the full Power BI potential and become a real expert, you’ll have to master DAX and SQL first (to start with) and have a lot of practice.
Also, some users report that Power BI is very sensitive to data formatting so for best results check your dataset before creating your visuals.
Limited compatibility: no Mac or Linux desktop
Power BI Desktop runs perfectly well on Windows, iOS, and Android, but there’s no desktop version for Mac or Linux. You can still go with the web version, but it can show slower performance and has limited functionality (e.g., not all data sources are available for connection, models can’t be created, and so on).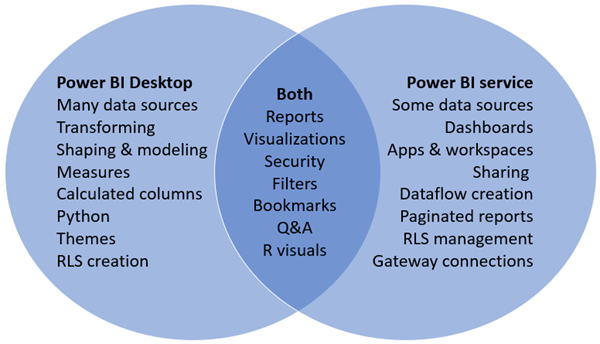
Difference between Power BI Desktop and Power BI Service
Limited dataset size
We said above that with the free Desktop version you can only upload 1Gb at a time. The Premium license will allow you to upload files up to 10 GB in size.
When dealing with large datasets, especially integrated from external sources, many users complain about connection difficulties, slow performance, and time-outs. So if you need to process massive amounts of information, it might be a bad choice for you.
Lack of localization
Currently, Power BI Service is available in 44 languages. However, the Desktop version doesn't support right-to-left languages (Arabic and Hebrew). Besides, not all the features are translated. Dashboards and reports created when you connect to services such as Microsoft Dynamics CRM, Google Analytics, and Salesforce are only available in English. So is exploring your data with Q&A.
Also, note that the auto date/time feature will localize month names using a different format string from the one common for Eastern Asian languages.
Confusing licensing
Power BI’s pricing structure isn’t completely clear and can be puzzling at first. The problem here is that the Pro version gives you richer functionality than the Desktop (and most importantly, the ability to share your content with other licensed users).
However, multiple tiers of the Premium version don’t give you more features than the Pro version but only add more storage/processing capacity. Meanwhile, other users in your company can only consume content but can’t create it unless they have a Pro license. So you still need to buy a certain number of those.
How to start with Power BI?
This part is dedicated to handy links and useful resources to consult if you consider working with Power BI. So here we go.
Documentation. Official Microsoft Power BI documentation is collected here. The same link will also take you to their help desk, REST APIs, and a suite of related products.
Downloads. Here’s where you can download all Power BI tools.
Community and news. This is the official Power BI community space where you can connect to peers, talk to experts, discuss your issues, and, you know, socialize. There’s also a dedicated blog where you can learn about the news, updates, and so on.
Microsoft learning. Here’s a collection of guided training options for those who need a deeper knowledge of the platform.
Certification. Microsoft provides a bunch of certifications for developers, administrators, data engineers, solution architects, DevOps engineers, and so on.
Third-party education. External platforms also offer a range of Power BI training and certification programs, e.g., check Coursera or Udemy.
Power BI alternatives: Power BI vs Tableau
Obviously, the BI market isn’t limited to Power BI and offers a lot of alternative solutions, with Tableau being one of the most popular tools and closest competitors. These platforms are designed with the same purpose: empowering business users to work with data, create meaningful visuals and reports, conduct deep, AI-powered analytics, and obtain valuable insights to support decisions.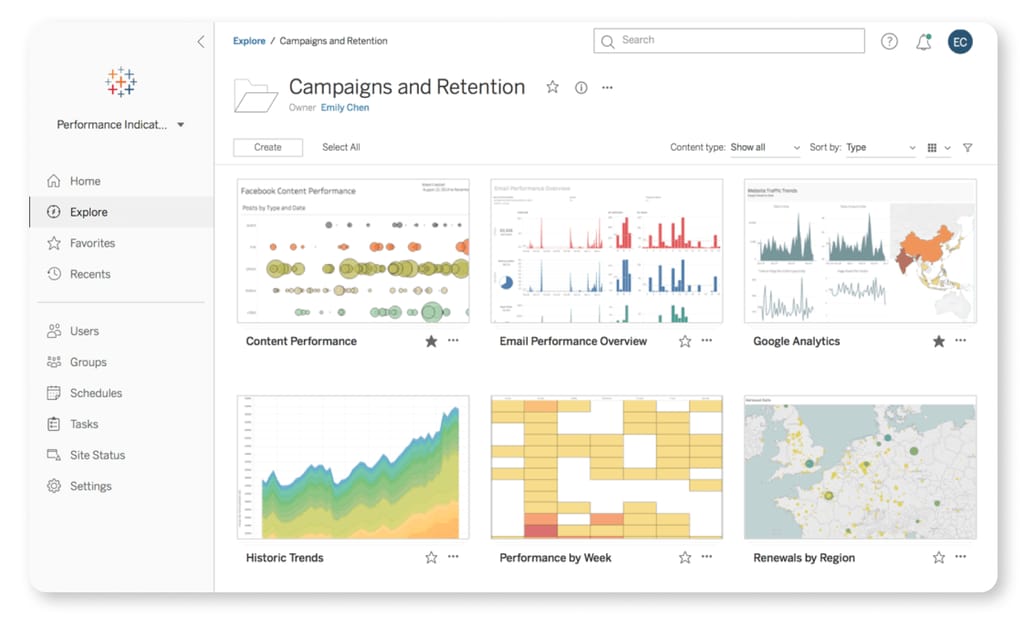
Tableau interface
The two solutions have a lot in common, but we can still outline some differences.
If we compare pricing, Power BI is cheaper overall and has a much more appealing trial period (60 days vs 14 days offered by Tableau). It’s also an obvious choice if you already work within the Microsoft ecosystem, i.e., Azure, Office 365, and Excel.
On the other hand, Tableau shows wider compatibility. Besides Windows, Android, and iOS, it’s also available on Mac and there’s a Tableau Linux Server version. Its other advantage over Power BI is that it performs better when handling large datasets.
As for usability, user-friendliness, and learning curve, Tableau is more complicated to learn and use. Tableau is designed for data analysts, offering them more capabilities and better performance, while Power BI caters to less skilled users as well and is generally easier to master and operate.
All in all, both BI market leaders have their pros and cons, and both have garnered immense, worldwide popularity and huge communities of avid fans. So your choice will be based on your business needs, available resources – and probably a pinch of personal preference.
This post is a part of our “The Good and the Bad” series. For more information about the pros and cons of popular technologies, see our other articles:
The Good and the Bad of Hadoop Big Data Framework
The Good and the Bad of C# Programming
The Good and the Bad of Java Programming
The Good and the Bad of Python Programming Language
The Good and the Bad of React Native App Development
The Good and the Bad of React Development
The Good and the Bad of Selenium Test Automation Software
The Good and the Bad of Xamarin Mobile Development
The Good and the Bad of .NET Framework Programming
The Good and the Bad of Angular Development
The Good and the Bad of Node.js Web App Development
The Good and the Bad of TypeScript
The Good and the Bad of Vue.js Framework Programming
The Good and the Bad of Swift Programming Language
The Good and the Bad of Ionic Mobile Development
The Good and the Bad of Android App Development

Maria is a curious researcher, passionate about discovering how technologies change the world. She started her career in logistics but has dedicated the last five years to exploring travel tech, large travel businesses, and product management best practices.
Want to write an article for our blog? Read our requirements and guidelines to become a contributor.