

Big Data enjoys a lot of hype and for a reason. But understanding the essence of Big Data and ways to analyze it is still blurred. The truth is, there's more to this term than just the amount of information generated. Not only does Big Data apply to the huge volumes of continuously growing data that come in different formats, but it also refers to the range of processes, tools, and approaches used to gain insights from that data. And that's the most important thing: Big Data analytics helps companies deal with business problems that couldn't be solved with the help of traditional approaches and tools.
This post will draw a full picture of what Big Data analytics is and how it works. Also, we’ll introduce you to the popular Big Data analytics tools and existing use cases.
Big Data and its main characteristics
Before we get to the detailed explanation of Big Data analytics, let’s define what Big Data is in the first place and what makes it, well, big, because not all data is.
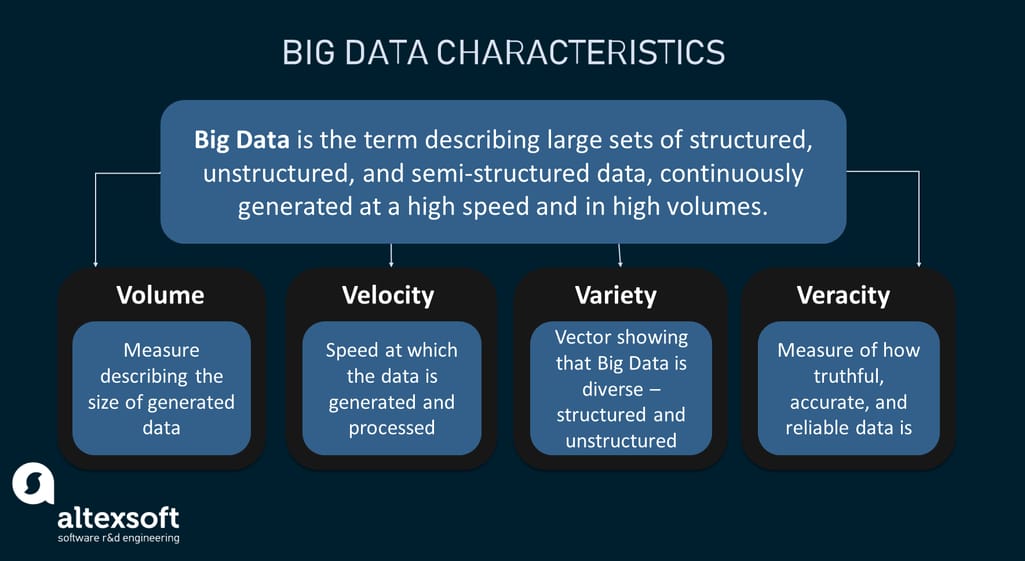
Big Data is the term describing large sets of diverse data ‒ structured, unstructured, and semi-structured ‒ that are continuously generated at a high speed and in high volumes. A growing number of companies now use this data to uncover meaningful insights and improve their decision-making, but they can't store and process it by means of traditional data storage and processing units.
Key Big Data characteristics
To understand Big Data, you need to get acquainted with its attributes known as the four V’s.
- Volume is what's “big” in Big Data. This relates to terabytes to petabytes of information coming from a range of sources such as IoT devices, social media, text files, business transactions, etc. Just so you can grasp the scale, 1 petabyte is equal to 1,000,000 gigabytes. A single HD movie on Netflix takes up over 4 gigabytes while you are watching. Now imagine that 1 petabyte contains 250,000 movies. And Big Data isn't about 1 petabyte, it's about thousands and millions of them.
- Velocity is the speed at which the data is generated and processed. It’s represented in terms of batch reporting, near real-time/real-time processing, and data streaming. The best-case scenario is when the speed with which the data is produced meets the speed with which it is processed. Let’s take the transportation industry for example. A single car connected to the Internet with a telematics device plugged in generates and transmits 25 gigabytes of data hourly at a near-constant velocity. And most of this data has to be handled in real-time or near real-time.
- Variety is the vector showing the diversity of Big Data. This data isn't just about structured data that resides within relational databases as rows and columns. It comes in all sorts of forms that differ from one application to another, and most of Big Data is unstructured. Say, a simple social media post may contain some text information, videos or images, a timestamp. etc.
- Veracity is the measure of how truthful, accurate, and reliable data is and what value it brings. Data can be incomplete, inconsistent, or noisy, decreasing the accuracy of the analytics process. Due to this, data veracity is commonly classified as good, bad, and undefined. That’s quite a help when dealing with diverse data sets such as medical records, in which any inconsistencies or ambiguities may have harmful effects.
Knowing the key characteristics, you can understand that not all data can be referred to as Big Data.
What is Big Data analytics?
Big Data analytics is the process of finding patterns, trends, and relationships in massive datasets that can’t be discovered with traditional data management techniques and tools.
The best way to understand the idea behind Big Data analytics is to put it against regular data analytics.
- Traditional approach. The analytics commonly takes place after a certain period of time or event. If you are an owner of an online shop, you may look at the data accumulated during a week and then analyze it. For instance, you calculate which customers used discount certificates that were sent to them by email.
- Big Data. The analytics usually happens in real-time ‒ as data is being generated ‒ and discoveries are presented almost instantaneously. Say, you operate a fleet of 100 trucks and you need to know the exact location of each as well as route delays in real-time.
Data generated from various sources including sensors, log files and social media, you name it, can be utilized both independently and as a supplement to existing transactional data many organizations already have at hand. Besides, it is not just business users and analysts who can use this data for advanced analytics but also data science teams that can apply Big Data to build predictive ML projects.
There are four key types of Big Data analytics singled out.
- Descriptive analytics is a common kind of analytics that allows you to find out what happened and when.
- Diagnostic analytics explains why and how something happened by identifying patterns and relationships in available data.
- Predictive analytics uses historical data to uncover patterns and make predictions on what’s likely to happen in the future.
- Prescriptive analytics provides specific recommendations on what should be done better.
You can check out our post about the analytics maturity model where we describe the aforementioned types in more detail. As for now, let’s move on to explaining the processes behind Big Data analytics and what tools make the whole thing work.
How Big Data analytics work: key processes
The concept of Big Data isn’t new: It is the culmination of several decades of growth of software and hardware that have made it possible for companies to successfully manage vast amounts of complex data. On top of that, new technologies are constantly being developed to store and process Big Data allowing data engineers to discover more efficient ways to integrate and use that data.
You may also want to watch our video about data engineering:

A short video explaining how data engineering works
Big Data analytics encompasses the processes of collecting, processing, filtering/cleansing, and analyzing extensive datasets so that organizations can use them to develop, grow, and produce better products. Let’s take a closer look at these procedures.
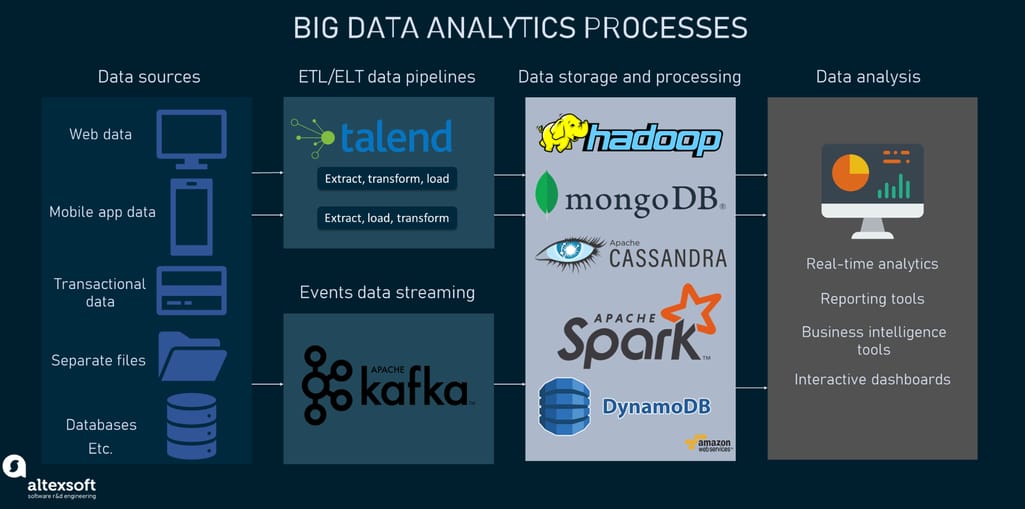
Big Data analytics processes and tools
Data ingestion
The process of identifying the sources and then getting Big Data varies from company to company. It's worth noting though that data collection commonly happens in real-time or near real-time to ensure immediate processing. Modern technologies allow gathering both structured (data that comes in tabular formats mostly) and unstructured data (all sorts of data formats) from an array of sources including websites, mobile applications, databases, flat files, customer relationship management systems (CRMs), IoT sensors, and so on.
Raw data must undergo the processes of extraction, transformation, and loading, so either ETL or ELT data pipelines are built to deliver data from sources to centralized repositories for further storage and processing. With the ETL approach, data transformation happens before it gets to a target repository like a data warehouse, whereas ELT makes it possible to transform data after it’s loaded into a target system.
Data storage and processing
Based on the complexity of data, it can be moved to the storages such as cloud data warehouses or data lakes from where business intelligence tools can access it when needed. There are quite a few modern cloud-based solutions that typically include storage, compute, and client infrastructure components. Storage layers allow data coming from disparate sources to be arranged in partitions for further optimization and compression. Compute layers are the sets of processing engines used to perform any computational tasks on data. There are also client layers where all data management activities happen.
When data is in place, it has to be converted into the most digestible forms to get actionable results on analytical queries. For that purpose, different data processing options exist. The choice of the right approach may depend on the computational and analytical tasks of a company as well as the resources available.
Based on the criteria of the use of one or several machines, processing environments are classified into centralized and distributed:
- Centralized processing, as the name implies, has all the processing happening on one computer system (a dedicated server that hosts all data). So, multiple users share the same resources and data at the same time. Along with the single point of control comes a single point of failure. If anything goes wrong, the entire system fails, not just a part of it.
- Distributed processing is used when datasets are just too vast to be processed on a single machine. Such an approach allows for breaking down large datasets into smaller pieces and storing them across multiple servers. This, in turn, makes it possible to process data in parallel. The great thing about the distributed approach is that data processing tasks can be moved to other available servers in case one server in the network crashes.
Based on the time of processing, there are batch and real-time approaches singled out:
- Batch processing, as the name suggests, is the method in which pieces of data, accumulated during a period of time, are processed in batches. This happens at a time when computational resources are readily available, saving on them but requiring some time to get the batch jobs done. Batch processing can be chosen over real-time processing when accuracy is on the agenda, not speed.
- Real-time processing ensures that data is always up-to-date due to the continuous input, transformation, and output of data items. This processing type implies that all the computational jobs are done within a short time span, usually in a matter of seconds or milliseconds. Think of fleet management software that tracks geographical position and route direction in real-time. More complex in terms of implementation, real-time processing is a great option for faster decision-making.
Data cleansing
Before getting thoroughly analyzed, data ‒ whether small or big ‒ needs to be properly cleaned to ensure the best possible quality and provide accurate results. In a nutshell, the data cleansing process involves scrubbing for any errors, duplications, inconsistencies, redundancies, wrong formats, etc., and as such confirming the usefulness and relevance of data for analytics. Any irrelevant or flawed data must be removed or taken into account. Several data quality tools can detect any flaws in datasets and cleanse on them.
Data analysis
Here's when Big Data turns into actionable insights that, among other things, is driving the development and competitiveness of companies. To make sense of the huge amounts of data, there are several techniques and practices. Below we list some of them:
- Natural language processing is the technology used to make computers understand and respond to human language, whether it is text or spoken words.
- Text mining is an advanced analytical approach used to make sense of Big Data that comes in textual forms such as emails, tweets, researches, and blog posts.
- Sensor data analysis is the examination of the data that is continuously generated by different sensors installed on physical objects. When done timely and properly, it can help not only give a full picture of the equipment condition but also detect faulty behavior and predict failures.
- Outlier analysis or anomaly detection is the technique used to identify data points and events that deviate from the rest of the data. It's widely applied in fraud detection activities.
Major Big Data analytics tools and services
It's worth noting that there's no all-encompassing tool or technology to apply to get Big Data analytics work. In most cases, you will have to combine several solutions to collect, process, and analyze the information. We’ll cover the key players worth your attention.
Apache Hadoop
Apache Hadoop is a set of open-source software for storing, processing, and managing Big Data developed by the Apache Software Foundation in 2006.

Hadoop architecture layers. Source: phoenixNAP
As you can see, the Hadoop ecosystem consists of many components. The core three include Hadoop Distributed File System (HDFS), Hadoop MapReduce, and Hadoop YARN.
- HDFS splits the data into smaller chunks (each sized 128MB by default) and stores them across different nodes in a cluster.
- The MapReduce processing engine is used to process the data stored in Hadoop HDFS in parallel by the means of dividing the task submitted by the user into multiple independent subtasks.
- YARN (Yet Another Resource Negotiator) is the Hadoop operating system that helps manage and monitor workloads.
NoSQL databases
NoSQL databases, also known as non-relational or non-tabular databases, use a range of data models for data to be accessed and managed. The “NoSQL'' part here stands for “Non-SQL” and “Not Only SQL”. Unlike traditional relational databases that sort all data into tables and rely on the SQL (Structured Query Language) syntax, NoSQL databases use different methods to store data. Based on the type of database there might be such store options as columns, documents, key-value pairs, and graphs. Thanks to flexible schemas and great scalability, NoSQL databases are the best fit for massive sets of raw, unstructured data and high user loads. Below are a few examples of such databases:
- MongoDB is a source-available NoSQL type database that makes use of JSON-based documents consisting of key-value pairs. Unlike relational databases with pre-defined schema, MongoDB has a flexible schema and can store any kind and volume of data.
- Cassandra is an open-source NoSQL database developed by Apache. It's highly scalable making it possible to handle huge volumes of data by replicating them into multiple nodes.
- Amazon DynamoDB is a fully managed NoSQL database that comes as a part of the Amazon Web Services portfolio. It is flexible, scalable, and high-performance, allowing users to store any amount of data and handle any load of queries.
To enrich your knowledge on this topic, read our detailed comparison of different database management systems.
Apache Spark
Spark is another Apache-family software that provides opportunities for processing large volumes of diverse data in a distributed manner either as an independent tool or paired with other computing tools. Basically, it does the same job as MapReduce. As one of the key players in the world of Big Data distributed processing, Apache Spark is developer-friendly as it provides bindings to the most popular programming languages used in data analysis like R and Python. Also, Spark supports machine learning (MLlib), SQL, graph processing (GraphX).
Talend
Talend is an open-source data integration and data management platform that empowers users with facilitated, self-service data preparation. Talend is considered one of the most effective and easy-to-use data integration tools focusing on Big Data.
Apache Kafka
Kafka is a scalable, open-source, fault-tolerant software platform used to collect Big Data from multiple sources. The platform is specifically developed by the Apache Software Foundation for high-speed, real-time information processing. Kafka has an event-driven architecture, meaning the system doesn't need to check for new data as it responds to events as they occur in real-time. In this way, the complexity of Big Data gets more manageable.
Real-life Big Data analytics use cases
Most organizations deal with Big Data these days, but few know what to do with it and how to make it work to their advantage. Below are real-life examples of companies using Big Data.
Healthcare: Ginger app uses Big Data for mental health monitoring
Founded by researchers from the Massachusetts Institute of Technology, the startup called Ginger.io makes use of machine learning technology and Big Data generated by smartphones to remotely predict when patients with any sorts of mental health issues are symptomatic.

The Ginger.io technology is powered by over 1.3 billion data points. Source: Ginger
Ginger.io is a mobile app that not only provides the functionality of real-life chatting with professional therapists and coaches but also allows therapists to gather and analyze huge volumes of patient behavioral data for more efficient health care. The app tracks and collects such data as the frequency of messaging and phone calls, sleeping and exercising patterns as this information can notify about a person’s mental health deviation. Say, when people have depressive episodes, they often go into isolation from other people and don’t call or message much. In contrast, a blast of phone calls and text messages can be a sign of a manic episode among patients with bipolar disorder.
eCommerce: Amazon analyzes Big Data to enhance its recommender engine
It won’t come as a surprise that the eCommerce and technology giant Amazon collects and analyzes the mountain of data about each of the company’s customers. This could be such information as the browsing or purchasing history of a user, demographic details, etc. The analysis of this data helps Amazon draw a complete picture of each user and create more targeted ad campaigns respectively.

Amazon’s personalized recommendations. Source: Amazon
As a result, thanks to the use of Big Data and its on-time analytics, Amazon's recommendation engine provides a top-notch shopping experience and encourages customers to purchase more products.
Hospitality: Marriott makes decisions based on Big Data analytics
Marriott is an American-based multinational company that owns various hospitality properties across the world. The company is a great example of how Big Data analytics can be used to guide business decisions and get competitive advantages in the industry.

Marriott Hotels’ peak/off-peak pricing is dynamic. Source: Marriott
Marriott applies the dynamic pricing automation approach to its revenue management that allows the company to make accurate predictions about demand and the patterns of customer behavior. To make this model work, it is required to have real-time data of different kinds. These may be metrics like revenue per available room, occupancy and cancellation, reservation behavior, to name a few, or data about weather, events, global and local economic situations. Analyzing the vast amounts of this data, the hotel chain can understand how its properties are doing against competitors and proactively adjust its pricing strategy for better outcomes.
Machinery: GE uses advanced Big Data analytics to optimize a wind farm
General Electric is a global digital industrial company providing services, equipment, and software solutions in different industries from healthcare to aviation to green energy. The company has installed sensors in machinery across all industries it operates to monitor every single aspect that can affect the performance of equipment.
For example, each of their 200 wind turbines includes nearly 50 sensors continuously streaming masses of operational data to the cloud. The sensor data is used to configure the direction and pitch of turbine blades to ensure the maximum rotational energy is being captured. Also, the data provides the site operations team with a view of each turbine’s health and performance. The use of Big Data helps the company fine-tune the processes and reduce downtime and losses.
Fintech: American Express leverages Big Data to detect fraudulent activity
The American Express Company puts Big Data analytics at the foundation of its decision-making. As of 2019, there were more than 110 million cards in operation with over 8 billion transactions. That's a lot of data to learn from. Just like other fintech companies, American Express considers cybersecurity its main priority. Consequently, the firm has invested in the creation of an ML model that uses different kinds of data such as spending details, card membership information, merchant information, etc. to detect any suspicious activity and make an instant decision to prevent credit card fraud. Check our video to learn more about fraud detection.

Fraud detection, explained
Final thoughts regarding Big Data analytics
Today, pretty much every business out there wants to be data-driven. To stay competitive and generate more revenue, companies must be able to make use of the data their customers provide. The key point here? They need to do a good job with the information that's already in place. Simply going for Big Data because it's the new hype and it seems that everybody’s after it isn’t the best idea. Without the understanding of how to use data and analytics, there's a decent chance that the investments in high-end analytics tools will fail to pay off.
So, before jumping on the Big Data bandwagon, make sure you are ready to handle all of that variety, veracity, velocity, and volume.