

Many people believe that shopping is therapeutic (and as a matter of fact, studies prove it). When you go to the local farmer’s market to buy fresh produce from a seller you have known for years or try on a trendy outfit after having an ice cream in your favorite mall, well, it’s a simple way to enjoy life.
In business, shopping -- or procurement -- isn’t that much fun. For most companies, it’s actually more of a tangled mix of stress, risks, and unfulfilled hopes that nothing will go wrong.
Procurement involves a wide range of activities, including choosing suppliers, negotiating terms, ordering, receiving, and inspecting goods, and paying invoices, to name a few. And every stage holds an array of challenges and uncertainties, kind of like walking blindfolded on a tightrope.
If you want to streamline your procurement and gain more visibility into this process, you have to get hold of available data, analyze it, and extract value to make informed decisions. In this article, we’ll explain what procurement analytics is, highlight the main difficulties within the purchasing process, and look at how analytics can address them.
Procurement and its challenges
Procurement is a set of operations related to finding, acquiring, and paying for goods and supplies for business needs. There are a few more terms that we’d like to clear up before we proceed to avoid miscommunication.
Sourcing is the process of finding the source of the necessary goods and services. It includes evaluating vendors, negotiating terms, managing contracts, etc.
Purchasing refers to actually buying the goods, i.e., issuing purchase orders (POs), receiving items, and inspecting them.
Accounts payable encompasses all activities related to handling invoices and making payments.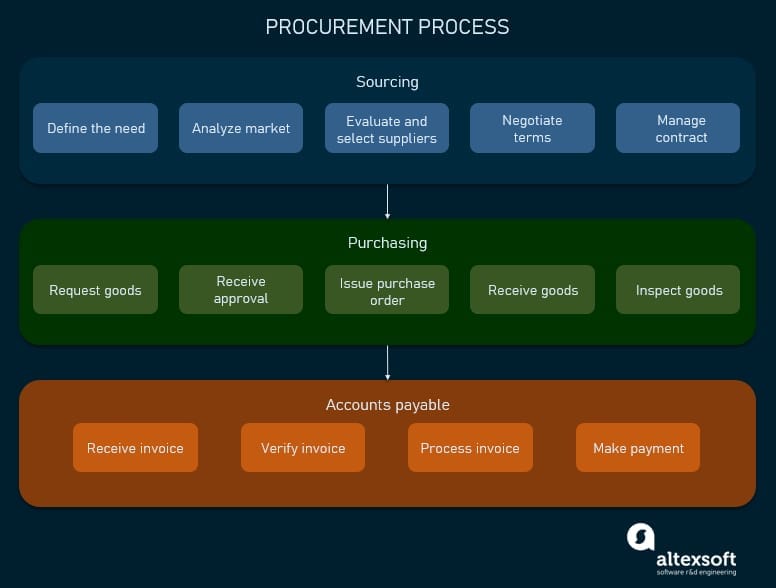
Procurement process and its elements
So, sourcing, purchasing, and accounts payable are the main components of procurement, also called the source-to-pay (S2P) process. Procure-to-pay or purchase-to-pay (P2P) is a subdivision of S2P that excludes sourcing.
Procurement is a cornerstone of a supply chain, being its first and basic stage. So, optimization of S2P operations is the basis for increasing revenue and streamlining the entire supply chain cycle.
In procurement, there are a number of challenges that directly impact productivity and ultimately, the company’s bottom line. Let’s briefly describe them at a high level before we get into more detail.
Sourcing challenges. Sourcing is about understanding your needs, exploring the market, establishing and maintaining relationships with suppliers, and managing contracts. The main problem at this stage is the inability to see the full picture and make accurate forecasts to enable choosing the right partner, plan production or sales, and negotiate the best deal.
Purchasing challenges. As you’ve decided on your suppliers and set up a delivery schedule, you just want it to go as planned. Unfortunately, often procurement managers are the last to know if something goes wrong. Without seeing the entire picture, they often fail to avoid problems before it’s too late or timely react to disruptions.
Accounts payable challenges. Accounts payable are most vulnerable to errors (whether deliberate or not) due to disconnected and inaccurate information, especially if you have to deal with a large amount of documentation and process multiple transactions. It’s a fertile soil for all kinds of fraud and corruption schemes.
Summing up all of the above, source-to-pay processes suffer the most from information inaccuracies, lack of general picture, and inefficient planning. Manual operations and/or outdated technology aren’t able to provide the required visibility and support your decisions. However, more advanced software is capable of analyzing all the available information, discovering inefficiencies, and highlighting areas for improvement. Let’s take a closer look at the opportunities to shine a light in the dark corners.
What is procurement analytics and the opportunities it offers?
Procurement analytics, also known as spend analytics, is the process of collecting various data and applying analytical techniques to get actionable insights and support decision making to improve S2P operations.
Procurement spend analytics helps assess your processes and find optimal answers to such business questions as
- What are we buying?
- In what amounts?
- How often?
- At what price?
- On what terms?
- From whom?
- Are we getting what we need?
- How can we reduce costs?
Procurement activities generate vast amounts of information. Actually, according to IDC research, today supply chains have access to over 50 times more data than five years ago. If analyzed properly, it can help optimize every stage of the process, decrease related risks and operational costs, and gain competitive advantage.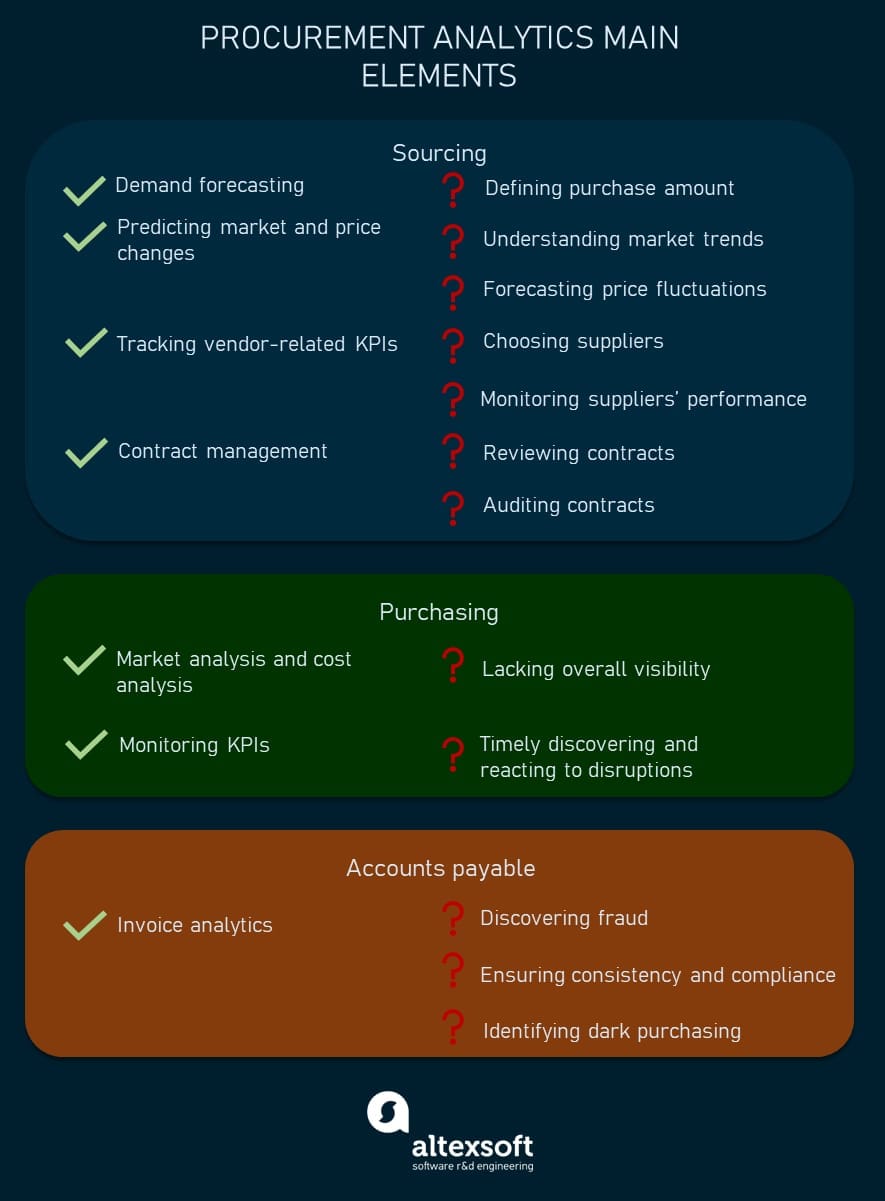
Main components of procurement analytics
So, let’s explore the main subsections of procurement analytics, discuss how they work, and find out how they can make your life easier.
Demand forecasting to define purchase amount
It’s difficult to predict the future, but businesses can’t be successful without accurate planning. You can’t make contracts and build delivery schedules effectively if you don’t know future demand, production or sales volumes, and the amount of goods you need. If you do, you risk missing out on wholesale discounts and encountering inventory-related problems such as stock outs or over stockings.
Demand forecasting is crucial for procurement as it allows you to estimate the necessary amount, type, and quality of goods or materials to be purchased based on the predicted level of consumer demand.

Check a brief video explaining how demand forecasting works
Depending on your analytical resources and the market you operate in, you can apply one (or both) of the two main approaches to demand forecasting.
Traditional statistical methods mainly use internal, historical data to predict trends within relatively stable markets. For example, there’s always demand for major raw materials such as wood, coal, wheat, or steel -- and the fluctuations are mostly rather moderate.
Meanwhile, machine learning (ML) techniques are capable of processing a wide range of both historical and current data from multiple external and internal sources. Based on all this information, you can get way more accurate and reliable forecasts that consider more factors and scenarios. Consider applying this approach if you work in a less stable environment, e.g., the automotive market, fashion, or food products.
There’s a concept known as demand sensing that also employs machine learning to analyze current fluctuations in market conditions and consumer behavior. It’s usually used to adjust existing predictions within fast-changing markets such as innovative technology.
Accurate forecasting is a foundation of intelligent planning and budgeting. It allows you to optimize inventory and avoid shortages or overstocking, thus reducing related costs.
In addition, having accurate, data-based forecasts can be a great help at the initial negotiating stage. It’s interesting that a recent study by Barclaycard Payments showed that 78 percent of senior procurement decision managers emphasize the increasing importance of data in supplier negotiations; moreover, about two-thirds expect data analytics to overtake people skills in the future.
Besides giving you knowledge and confidence needed for effective negotiation, it’s also a basis for getting favorable terms. For example, often negotiated prices depend on the amount of future purchases (the more you buy the bigger discount you can get). So, knowing your future demand level, you’ll be able to secure the best deal for your company.
However, you have to remember that ML approaches are about building and maintaining complicated data infrastructures which requires significant investment and computing power.
Detecting and predicting price changes
The market is constantly changing due to a myriad of factors. To succeed, you have to be able to forecast consumer behavior, price changes, impact of innovations, and so on. Based on the market situation, prices might be changing multiple times per day. When securing long-term contracts, you have to be sure that you’re not missing out on possible savings.
So, implementing data aggregation and price forecasting techniques that collect the market data from various external sources (for example, you can connect to such information providers as Beroe to monitor market fluctuations) will allow you to get accurate price predictions that you can use to plan your procurement strategy and create budgets.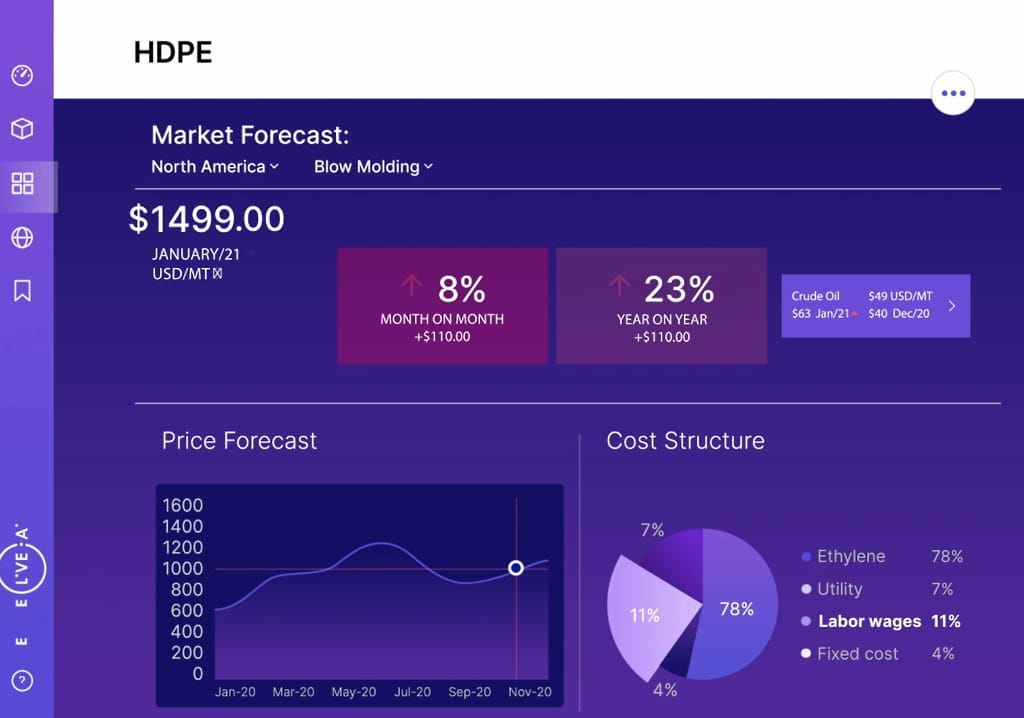
Price forecast with Beroe
It’s not only about forecasting though. For example, you can discover the reduction of the market price for some items, while your supplier has a higher price in the catalogue. As you’re informed about the change, you can approach your partner, discuss the discount, and avoid unnecessary spending.
Tracking vendor-related KPIs to choose suppliers and monitor their performance
You have to understand how your supplier partners are performing throughout your cooperation, track how they fulfill their obligations, and compare them to their competitors. That will make you confident you made the right choice -- or give you a reason to look for a different vendor. However, doing it manually is rather complicated as multiple KPIs have to be calculated and monitored, not to mention tracking various market information from multiple external sources.
Typically, the first thing to consider when you choose a supplier is the price. You can request quotes from various vendors and then compare them side by side, as well as to related market prices, Federal Government established prices, historical prices, and so on.
If you use a separate RFI (request for information), RFP (request for proposal), or RFQ (request for quote) platform, you’ll have to integrate it with your ERP or procurement system to collect the necessary supplier data.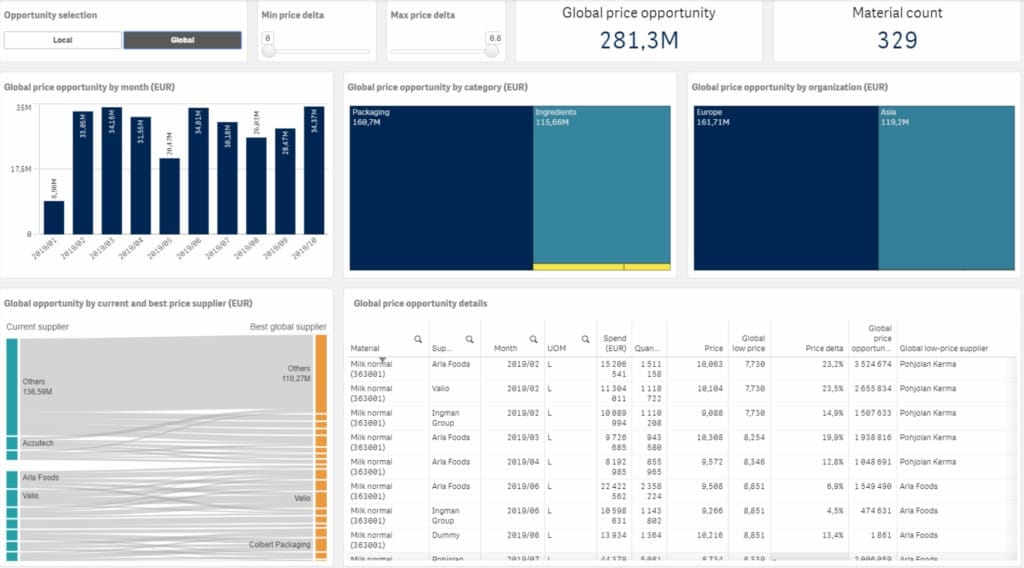
Price analysis dashboard by Sievo with opportunities overview
It’s also important to compare your potential partners not only by their price levels, but also by other factors that will show their reliability. To analyze that, you’ll have to collect available data from external sources such as market reports, peer reviews, and public financial statements.
Procurement management or analytics tools must integrate with major market information providers as D&B, Cerved, and Bureau van Dijk. If you design a custom solution, you’ll have to establish connections yourself to create a data flow and make use of the market suppliers’ information, risk ratings, and other insightful analytics reports.
Throughout your cooperation, you also have to track such important KPIs as
- lead time,
- percent of missed or delayed deliveries,
- defect rate and rejection rate,
- backorder rate,
- frequency of price changes,
- communication time lags, and more (we’ll talk more about KPIs further on).
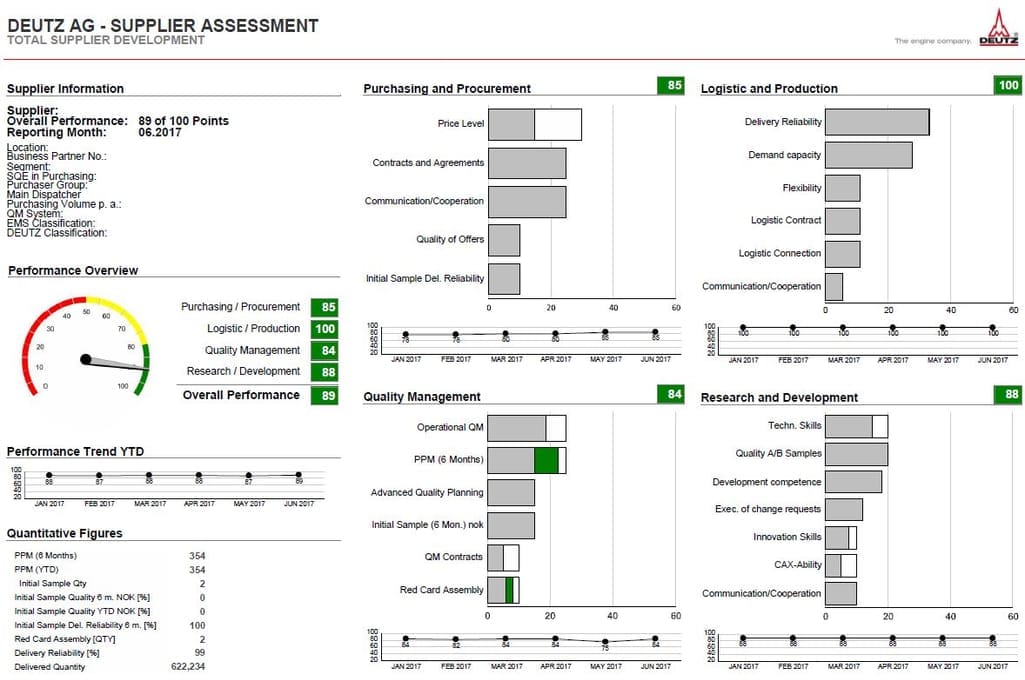
Supplier assessment dashboard. Source: Deutz
Also, today advanced analytical platforms are capable of conducting accurate risk assessment. Using internal (such as late delivery or defect rate) and external data (such as supplier company reports, news, aforementioned analytical platforms, or even social media), such solutions can identify risks in advance and help avoid supply chain disruptions by suggesting substitutions for the supplier or taking preventive measures.
Monitoring your partners’ performance will help you choose the right supplier, reduce overspending by securing the best prices, mitigate quality and delivery risks, and establish strong business relationships.
Contract management to review and audit agreements
Whether a new or existing contract, it has to be thoroughly reviewed to ensure clear, unambiguous phrasing of all clauses and variations, compliance to current regulations, absence of hidden risks, pitfalls, or fees, and so on.
If you deal with multiple suppliers, you most probably have to handle a multitude of agreements -- and go insane as you stumble through that legal abracadabra. However, it’s an important business practice since overlooking a seemingly insignificant clause or misinterpreting it can result in tangible losses.
It’s also necessary to review your contracts and SLAs (service level agreements) and make sure all the parties are compliant with the agreement and fulfill their obligations to the full extent. Otherwise, you risk either incurring penalties or not getting what you agreed upon.
The International Association for Contract and Commercial Management (IACCM) research showed that on average, companies lose around 9 percent of annual revenue due to poor contract management. Digitization has already greatly improved this business aspect, facilitating contract creation and editing, introducing e-signatures, increasing security, tracking expiration dates, and enabling convenient search and storage functionalities. However, advanced analytics can go even further.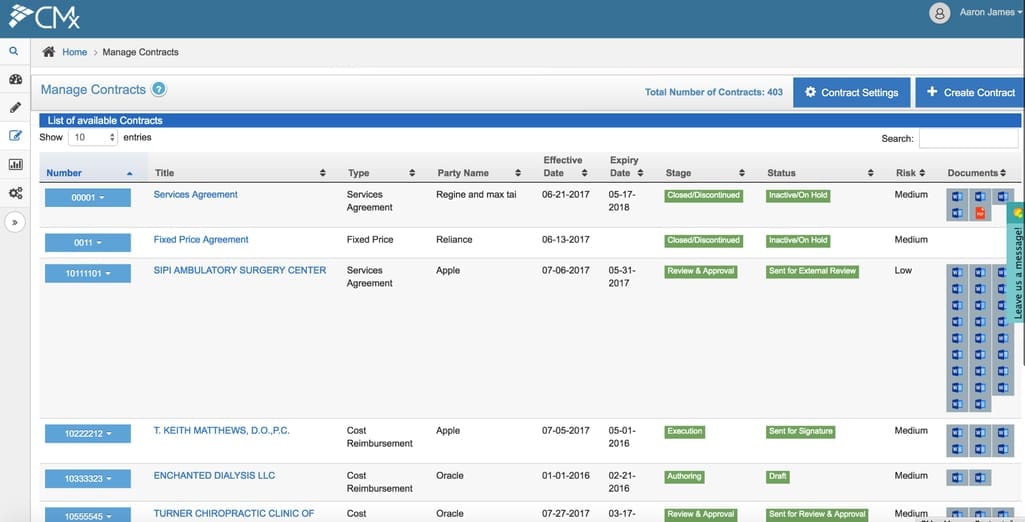
ContractExperience platform
Today, analytical software applies ML-based techniques such as optical character recognition (OCR) and natural language processing (NLP) to manage contracts. OCR helps recognize handwritten, typed, or printed text within scanned images (for example, hand-written invoices or pdf contracts) and convert it into a machine-readable format. NLP can extract information from documentation, interpret it, categorize, organize, and apply other analytical methods.
ML-based contract management software helps automatically review and audit new and existing contracts and agreements (usually, implementing robotic process automation or RPA). And it’s not only about text recognition, clause classification, and search functionality. You can discover documents that lack wording consistency or predefined approved terminology, contain unclear clauses, or hold variation risks for you.
Ambiguity detection. For example, provisions that outline confidentiality, termination, and dispute resolution are crucial and have to be clearly stated so that no misinterpretation is possible. A trained ML model can find and highlight inconsistencies and ambiguities or flag missing elements such as currency fluctuation clauses.
Contract audit. Software can monitor the outcomes of the contract such as supplier performance and milestones by extracting the agreed terms (e.g., price or delivery time) from the contract and comparing it to the actual cooperation results.
Compliance evaluation. Advanced tools can also compare your documentation to the latest legal and regulatory requirements to ensure compliance (or identify gaps). For example, you can supply your ML software with a sample approved text (read about what supervised learning is) and it will search through all your existing contracts for the same or similar piece. In this way, you’ll get a list of compliant and non-compliant documents that need to be updated.
All this can help you avoid risks, save time, find opportunities (such as unused credit limits), and cut costs (not to mention reducing your lawyer's workload).
Invoice and payment analytics to detect errors, compliance issues, and fraud
Invoice analytics generally targets three main problem categories: compliance, fraud, and dark purchasing.
Tax compliance evaluation. Managing documentation properly is crucial for accurate tax handling. Companies must meet a large number of conditions based on legal regulations to maintain compliance that include requirements related to
- formatting,
- content,
- security,
- archiving,
- connections with government institutions, and so on.
Manual invoicing makes compliance quite difficult and can result in serious tax-related issues.
Fraud detection. Except for unintentional -- yet often inevitable -- errors caused by manual handling (such as duplicate or unmatched invoices), multiple fraud schemes exist at this stage.
Fraud is an age-old, acute problem worldwide. According to the 2020 Report to the Nations, companies lose around 5 percent of revenue because of occupational fraud which equates to trillions of dollars at a global scale. Considering that a typical fraud case lasts 14 months before it’s detected, causing an average loss of $8,300 per month… Well, the sooner you find out, the less money you lose (thanks, Captain Obvious).
Dark purchasing detection. Dark or maverick spending refers to purchases made outside the defined procurement procedure without following pre-established policies. Even if done unintentionally or for the most innocent reasons, such uncontrolled spending can be extremely costly for your business. Such items are difficult to control and justify, you can lose your discounts or fail to fulfill contract terms (in case you have a predefined purchase amount), and as if that wasn't bad enough, it can damage your reputation and relationships with suppliers.
For example, let’s say you annually spend $1 million on MRO, buying from a trusted supplier that gives you a 10 percent discount. If your dark spending is 20 percent, it comes to $200 thousand worth of goods bought without discount, or $20 thousand of lost savings.
Automation can significantly streamline the accounts payable (AP) process as it helps in reducing errors, reviewing consistency and compliance, increasing accuracy in matching an invoice with a purchase order (PO), and even offering self-invoicing solutions.
With specialized analytical tools, you can better control your cash flow, evaluate the accuracy of payments, and track such payment-related KPIs as purchase order lifecycle.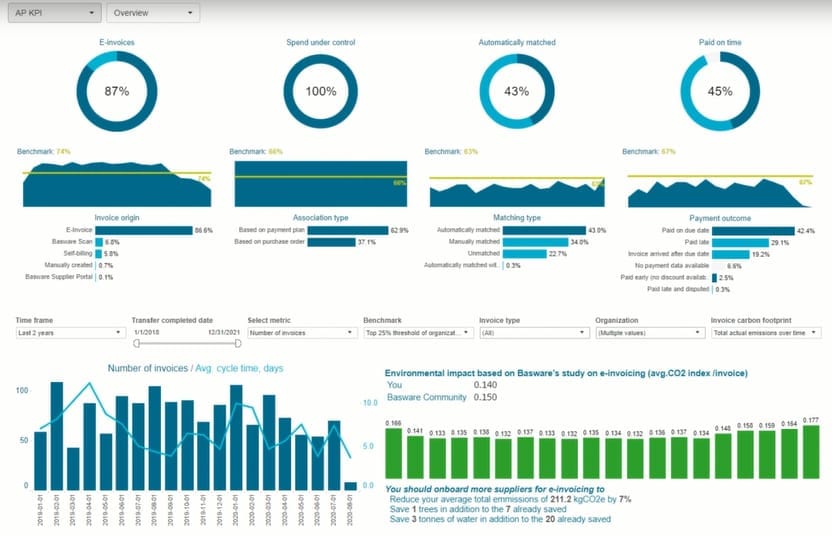
Payments analytics with Basware
One of the main objectives of analytical tools in the accounts payable process is fraud detection. To detect suspicious transactions, software scans documentation in search of
- duplicate payments,
- unusually large transactions or invoice amounts (for example, there was 1 invoice in June and then 50 in July),
- payments just below approval threshold,
- any matches in invoice information and employee details (address, name, phone number, etc.),
- missing details in invoices,
- vendor address that looks like residential address,
- free email addresses (usually companies have their own domain name), etc.
Maverick spending can also be detected with the help of software by comparing contracts with actual transactions made and detecting discrepancies.
E-invoicing and analytical tools also apply the aforementioned ML techniques for intelligent document processing such as OCR, RPA, and NLP to manage and analyze invoices.
Cost analysis
Procurement includes direct and indirect spend. Direct spend refers to acquiring goods and services that are directly related to your company’s products (e.g., raw materials, parts, items for reselling, etc.). Indirect spend is any expenses required to operate the business, such as office supplies, utilities, transportation, insurance, marketing, business travel, warehousing costs, wages, and so on.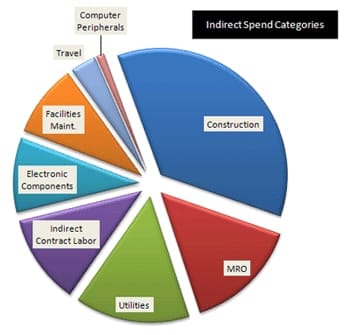
Indirect spend elements. Source: Procurement2011
Direct spend is more obvious and is easier to monitor, so many companies can be unaware of indirect spend breakdown and underestimate its impact on the bottom line. However, the latter often takes a significant share of total expenses, so it’s important to conduct cost analysis and hold indirect expenditure under control to avoid extra spending.
Software can categorize your spendings and provide an understanding of where your money goes. Such visibility can help you identify inefficiencies and find savings opportunities. For example, you can centralize spendings across different departments and get discounts for bulk purchases.
Procurement metrics and KPIs
If you as a business owner or manager don’t know what’s going on within your organization, you aren’t able to timely take measures in case of unplanned situations (and those are sure to happen, no doubts). For example, such problems as late deliveries or understocking can be avoided (or more easily handled) if you have complete information and full control of the process.
KPIs are quantitative values that are used to measure success of a specific activity or to evaluate progress towards a business objective.
In procurement, there are several main groups of KPIs that are worth monitoring to get a better understanding of the effectiveness of your operations. We’ll describe the most essential metrics, but the list is nowhere near exhaustive since every company should choose the ones that fit best, depending on the business size and type.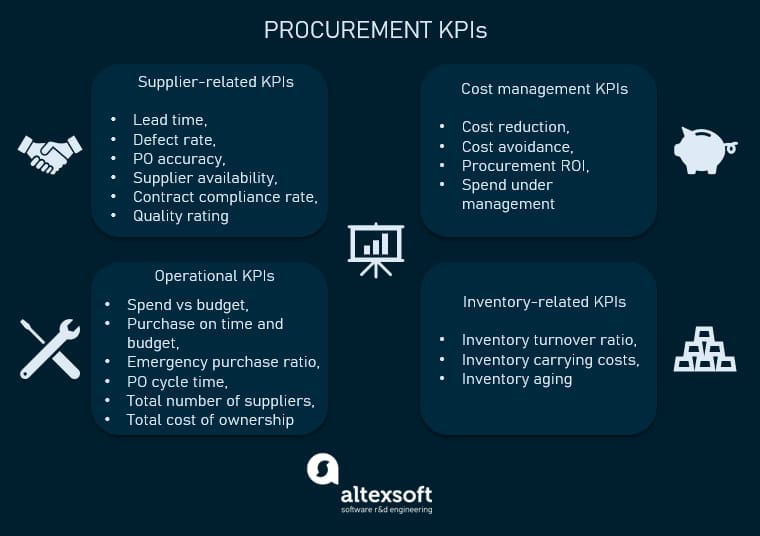
Main procurement KPIs
Supplier-related KPIs
Here are the principal KPIs that will allow you to evaluate and monitor your suppliers’ performance. Such data will help you choose the best and most reliable suppliers as well as negotiate future contracts.
Supplier lead time is the period between the moment a vendor receives your PO and the moment you receive the requested items. It shows how fast your partner processes orders and delivers goods.
Supplier lead time = Delivery time – Order time
Supplier defect rate measures the quality of items provided by a particular vendor. It’s usually stated as a percentage or in terms of defects per million.
Supplier defect rate = (Number of defective units / Total number of units tested)*100
PO accuracy refers to the number of correctly fulfilled POs, i.e., delivery of the right items at the right time.
PO accuracy = Number of correctly fulfilled POs / Total number of POs
Supplier availability estimates the capacity of your partner to fulfill your needs, including emergency requests. It shows how reliable and responsive the supplier is.
Supplier availability = Number of times items were available / Total number of orders
Supplier contract compliance rate (or SLA compliance rate) measures the vendor’s compliance with business requirements and negotiated contract terms. It considers delivery time, number of delays, reaction time in case of issues, difference between the price paid and the price quoted, etc.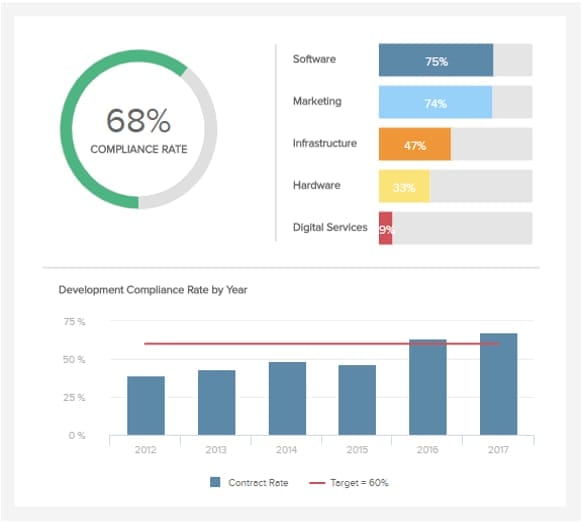
Datapine supplier compliance estimation
Supplier quality rating is similar to the previous one. It’s the collective measure of your partners’ performance that helps to compare them to each other. You can also use a vendors’ scorecard to visualize their performance on one dashboard and compare by different criteria.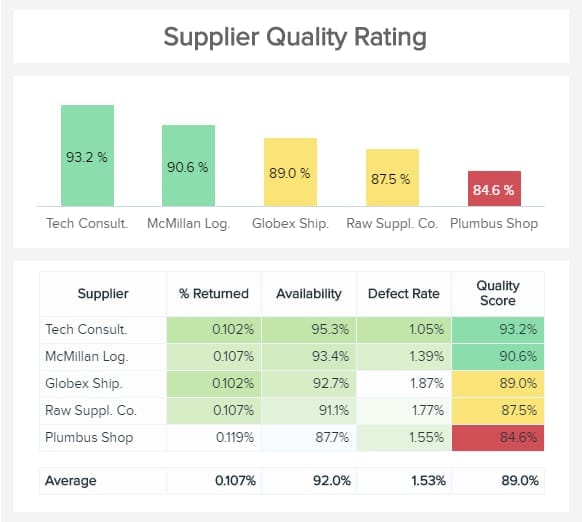
Datapine supplier rating dashboard
For a fuller picture, you can also monitor communication time lags, price competitiveness, frequency of price changes, and other performance-related metrics.
Operational KPIs
This group of KPIs is focused on evaluating how efficient your procurement process is.
Spend vs budget measures the accuracy of budgeting. The less the difference, the better your procurement planning works. It’s also important to understand the alignment with stakeholders and the finance department.
Purchase on time and budget is related to the previous metric; it calculates how many orders are completed timely and within the planned budget.
Purchase on time and budget = Number of correctly fulfilled orders / Total number of orders
Emergency purchase ratio is a reverse metric. It shows the part of unplanned orders, usually because of inventory shortages. Emergency orders are often fulfilled at higher cost, so it might mean extra spending. It can also be an indicator of poor planning.
Emergency order ratio = Number of emergency orders / Total number of orders
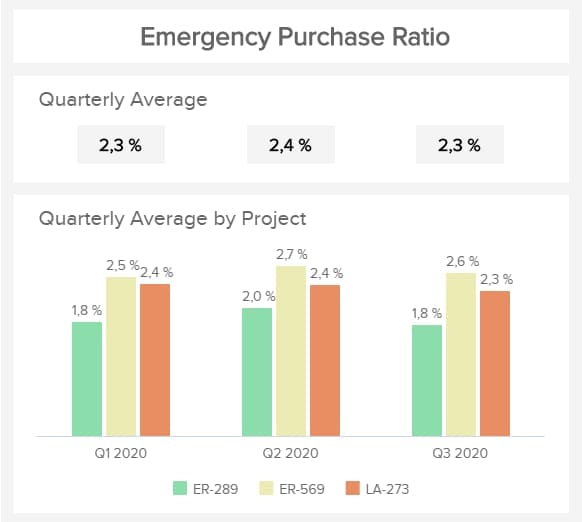
Datapine emergency purchase ratio dashboard
PO cycle time refers to the PO lifecycle, i.e., from the order creation until it’s paid. It helps monitor the overall performance stability. The shorter the PO cycle is, the higher your turnover is likely to be.
This KPI also helps categorize your suppliers. Typically, it’s three groups: short cycle (4 days or less), medium (4-8 days), and long (more than 8 days). It allows you to identify those that can handle urgent orders.
Total number of suppliers isn’t related to suppliers’ performance. It rather shows your dependency on your partners. Too many suppliers reduce the possibility of discounts while too few suppliers show a high level of dependency. Here, there is no optimal value; you have to find the right balance for your company and pay attention to other metrics that evaluate your partners. The ratio of contracted (ones that agree to your requirements and compliance terms) and unlisted suppliers is also individual.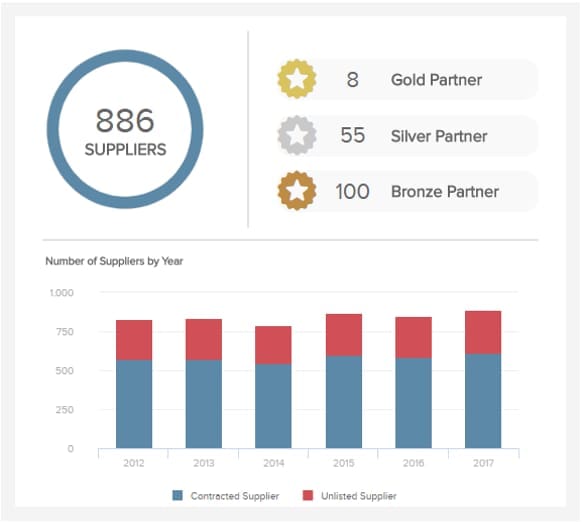
Datapine supplier evaluation dashboard
Total cost of ownership is also called a long-term price since it takes into account both direct and indirect procurement spend, i.e., the purchase price and any related operating expenses. It’s used to analyze what it actually costs to acquire and maintain inventory as it gives a holistic view of a company’s purchase spend.
Cost management KPIs
Cost savings is one of the main objectives of your procurement management. So, this group of KPIs show how effective your cost and procurement strategies are and what the impact on the company’s bottom line is.
Cost reduction KPI is measured by comparing the old and current cost for the purchased goods and services. It’s an important KPI that shows the amount of “hard savings” that were achieved due to your strategic efforts.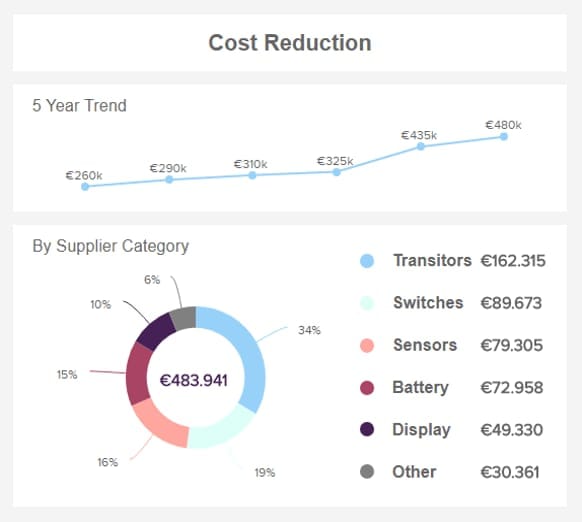
Datapine cost reduction dashboard
Cost avoidance KPI refers to the “soft savings” or avoiding potential extra expenses in the future. It’s less obvious and harder to measure since they are not mentioned in the income statement (that’s why they are often overlooked). However, they still impact the bottom line. Some examples of such savings are investing in new technology or entering into long-term contracts to get better discounts or avoid price fluctuations.
Procurement ROI determines the profitability and cost-effectiveness of your internal investment for the procurement department. If ROI is 10 times greater than the amount of investment, it’s considered a good result of your strategy.
Procurement ROI = Annual cost savings / Annual procurement cost
Spend under management is a complex managerial KPI that shows what control you have over your expenses. It can be calculated by subtracting maverick spend (which is out of your control) from the total approved spend budget.
Inventory-related KPIs
Procurement deals with goods or, in other words, inventory. So tracking inventory metrics can also show how effective your procurement management is.
Inventory turnover ratio measures how fast your inventory is used or sold. It can show the effectiveness of your inventory planning and management efforts. Typically, a high turnover ratio indicates strong sales or insufficient inventory.
Inventory turnover ratio = Total cost of inventory used or sold / Average value of inventory
Inventory carrying cost includes any expenses that are related to storing inventory, e.g., electricity, warehouse lease, shrinkage, etc. It’s a company overhead, so if it’s value is high, look for improvement opportunities (such as perfecting your inventory planning or optimizing your inventory management activities).
Inventory aging shows how long the item is stored as inventory. It’s costly to hold too much inventory and besides, you have your cash tied up if it’s just lying there on the warehouse shelf. So, a high value is also a reason to reconsider your inventory strategy.
In addition to these main groups of procurement KPIs, there are also such categories as employee-related KPIs and sustainability metrics. However, they are less related to operational efficiency and strategic management, so we’ll not cover them here.
Procurement analytics infrastructure
Traditionally, analytics is associated with business intelligence and data visualization that are focused on studying past events and current processes. However, today it’s much more than that. Also known as predictive analytics, it’s about discovering hidden patterns and dependencies, forecasting future events, and supporting decisions with data.
There’s a certain evolutionary path each company takes on their way of analytical development and relying on data in strategy- and decision-making. Check our article about analytics maturity to identify what stage your company’s at. Meanwhile, we’ll describe the process of turning the raw data around you into actionable insights.
But before we dive in, consider reading about data engineering to get an idea of the main concepts and stages.
Watch our cool explainer about how to manage data and get business value
Extract data
Data is everywhere, scattered all around in various formats. To analyze your procurement operations, you can use data from both internal and external sources.
Internal data sources include
- ERP or other business management software such as a warehouse management system or an inventory management system,
- accounting system (financial information, transaction history, etc.),
- purchase orders, and
- other internal information such as Excel spreadsheets, databases, paper documents, etc.
External data sources include
- data shared by suppliers,
- market reports,
- credit ratings,
- currency rates,
- public financial statements,
- risk and CSR profiles and ratings,
- external databases,
- external indexes, etc.
Now the trick here is not to collect as much data as possible but to carefully choose what data would be useful for analytics purposes. Information trustworthiness is also a crucial aspect. For example, a 2020 Supplier Information Study showed that 93 percent of procurement specialists had issues as a result of misinformation about their partners.
Also note that data extraction, even from internal sources, is a complicated task that requires significant time, effort, and investment. You might have to hire a data scientist to help you choose the right sources -- and a data engineer to build integrations between systems.
Data extraction is the first stage of the so-called ETL process or data pipeline. Building and maintaining it is also the task of data engineers. Now, let’s proceed to the next step.
Consolidate data
Once you’ve extracted data, you have to store it somewhere. If you mainly deal with structured data, which is organized, comes in just a few predefined formats (such as spreadsheets or documents that contain names, addresses, numbers, etc.), and can be easily arranged in tables, a data warehouse is your choice. It's a central repository of information where it’s systematized and stored.
If you want to collect raw, unstructured data, you’ll most likely need a data lake. Such data comes in a variety of formats (e.g., scanned specifications, emails, or even social media posts) and is harder to process.
If you want to know more about the differences between structured and unstructured data, have a look at our dedicated post. And we’re getting to the next step.
Prepare data
We described the whole process of data preparation in a dedicated post. In a nutshell, to make use of available information, you have to check data quality first and then format it to make it consistent.
There are various techniques applied at this stage (those might include data mapping, reduction, labeling, normalization, formatting, and more) that allow you to clean and structure information, making it ready for further processing. For example, you might need to standardize formats, languages, and currencies to extract value from your PO data.
Watch a short video about main data preparation steps and techniques
Process data
Now, the fun part. You have your data all set and ready for analysis. So, what can you do? Depending on your analytics maturity level, you can apply different techniques -- and get different results.
Descriptive stage: If you only have access to a limited number of sources (mostly internal ones) and don’t have a developed data infrastructure, the simplest thing you can do is convert your information into easy-to-digest dashboards and reports. They would allow you to monitor main KPIs, categorize your suppliers and expenditure, and give basic understanding of your procurement processes.
At this stage, typically, no specialized software is implemented. Instead, the basic analytical and reporting modules of ERP (or other business management software), BI tools, or even Excel spreadsheets are used to make visualizations and identify trends.
Diagnostic stage: As businesses realize the value of data, they start collecting more information and applying more advanced analytics methods and approaches. For example, data mining helps find hidden, unobvious patterns and dependencies and can help detect compliance issues, fraudulent transactions, and maverick spending; or, process mining techniques let you assess and optimize your existing processes.
Here, data scientists and data engineers are involved to build and maintain data pipelines which might include data warehouses and even data lakes.
Predictive stage: We’ve already explained why making precise forecasts is the basis of accurate resource planning, budgeting, negotiating contract terms, and other crucial procurement processes. Collecting and analyzing large amounts of diverse information from a number of internal and external sources would allow you to understand what is likely to happen in the future -- and make more effective sourcing decisions.
At this stage, there’s no way you can avoid building a machine learning (ML) infrastructure and engaging ML engineers to process all those data masses. Note that creating and maintaining an ML pipeline requires significant investment as you’ll have to involve a team of data scientists and acquire specialized hardware and software.
However, the benefits are truly tangible. Forecasting demand, predicting price fluctuations, and understanding market trends would allow you to identify opportunities for savings and process improvements, as well as create accurate budgets and effective strategy.
Prescriptive stage: At its highest level, analytics is capable of automatically suggesting optimization options and providing decision support by giving actionable recommendations. You could simulate different what-if scenarios to find the optimal course of action. Risk assessment, supplier evaluation, and strategic decision-making based on huge amounts of historic and current data would be most accurate and lead to maximum business efficiency.
Visualize data
People are more likely to consume information that's been made digestible, so creating readable reports and user-friendly visualizations is important. At basic stages of analytical development, such dashboards are included in ERP or other business systems in use, while at higher levels, various BI tools are implemented as part of a data pipeline to visualize analytics results.
Procurement analytics software and its implementation approaches
According to the Deloitte Global 2021 Chief Procurement Officer Survey, operational efficiency is the priority for 78 percent of respondents, closely followed by cost reduction (76.4 percent) and digital transformation (76.1 percent). As you can plainly see, they are tightly interconnected, since implementing advanced technology as part of a business digital strategy delivers improvements in efficiency and uncovers savings opportunities.
So, how can you grasp the benefits of analytics for your procurement department? What technologies should you be looking for? Well, there’s no single answer because it all depends on your current situation, your business needs, and available resources. But let’s look at some of the common scenarios.
A module in existing systems. You most probably use some type of management software such as ERP (e.g., Oracle, SAP, or NetSuite) or a specialized procurement tool (e.g., Procurify, Precoro, or Kissflow). Most of them have a reporting and analytical module to allow you to conduct most basic analysis and track main procurement KPIs.
BI software. BI tools and visualization platforms such as Microsoft BI, Tableau, or QlikView can also be a solution as they have customizable dashboards and powerful visualization capabilities. However, they are not industry-specific and might lack procurement-related metrics or be unable to provide the necessary granularity or analysis.
Procurement analytics software. To get more valuable insights, you can adopt a more focused software designed for analytical purposes specifically in procurement, such as Sievo, Simfoni, or GEP Smart. Such platforms can process information from a variety of sources and conduct more advanced analyses.
Separate specialized tools. Another way to get high quality results is to implement a narrow focused software for each process, i.e., one for contract management, another one for supplier management, and so on. It might have richer functionality to address the specific problems within each procurement aspect, however, for them to work well together, you’ll have to establish a bunch of custom integrations and ensure a seamless data exchange.
Custom solution. In case you want to grow your analytical maturity level and tackle big data, you’ll need a custom developed data architecture. Designed and built as a part of your business workflow, it’s tailored to meet the unique needs of your procurement process.

Maria is a curious researcher, passionate about discovering how technologies change the world. She started her career in logistics but has dedicated the last five years to exploring travel tech, large travel businesses, and product management best practices.
Want to write an article for our blog? Read our requirements and guidelines to become a contributor.