

Vacation and short-term rentals are experiencing a post-COVID renaissance. The data clearly shows the stable, worldwide increase in demand for alternative accommodations, from apartments to farm and igloo stays. The data also indicates that more and more companies in the sector bind their bright future with… data.
According to the Global Vacation Rental Report 2022, 40 percent of property managers rely on market business intelligence (BI) or analytics services, a big leap compared to just 13 percent before the COVID-19 outbreak. And 58 percent are planning to use even more data or spend more on data products. By doing so, they arm themselves with competitive insights into pricing, availability, and other aspects of rental business. This, in turn, helps them make smarter decisions on how to maximize revenue.
In this article, we’ll focus on short-term rental data sourcing and analysis, and share our experience gained from cooperation with Japan’s largest booking platform Rakuten Travel, vacation rental market data provider Key Data, and other tech partners.


Vacation rentals, explained
Why rental data is important and where to get it
Before going any further, let’s clarify what vacation rentals are. This term refers to hotel alternatives that can be booked for several days or weeks (hence, the second name — short-term rentals.) Such accommodations embrace a wide range of properties, from luxury apartments and villas to spare bedrooms or even tents.Vacation rentals usually offer guests more attractive prices than hotels along with a more private setting. Another selling point is availability of a kitchen that enables guests to save money on food. While these benefits are quite obvious, companies managing alternative accommodations must have more tricks up their sleeves to prosper in so competitive market, with 23,000 vacation rental businesses operating in the US alone.
How does data come in handy? Having relevant observations and powerful analytics tools at hand, property managers can
- compare their rates and performance metrics with those of competitors,
- analyze demand,
- monitor supply,
- tweak prices to rise occupancy, and more.
Vacation rental data sources: PMS, Airbnb, Vrbo, and others
The largest aggregators of data on alternative accommodations are global platforms like Airbnb or Vrbo. Yet, the most complete information possible accumulates right in your own vacation rental software. To get reliable insights, you have to use both internal and external sources and look at a one-year history of bookings at a minimum (two to three years’ worth of data will bring far better results.)Vacation rental software: PMS, channel manager, website
Your property management system (PMS) for vacation rentals, channel manager, and website serve as the most reliable source of booking information. The software captures a lot of nuances from reservation details — including the rate at which a certain accommodation was reserved at a certain date to guest profiles and reviews.Since your system is limited to the inventory you sell, to get a full picture, track market trends, and analyze competitors, you need data aggregated by third-party platforms. For example, Key Data, which specializes in generating actionable insight for small and mid-sized vacation rental businesses, sources information from over 700 partner PMSs, tourism groups, and destination management companies.
Airbnb data
Launched in 2008, Airbnb is now the biggest peer-to-peer home-sharing marketplace. As of 2022, it has over 7 million active listings from 220 countries, with 14,000 new hosts joining the platform monthly. Watch our video to learn the Airbnb story of success.
How Airbnb creates the future of travel.
Obviously, the platform accumulates a huge amount of data that can drive different types of analysis. The question is how to obtain this wealth. It’s worth noting that Airbnb prohibits running “bots, crawlers, scrapers, or other automated means to access or collect data or other content from or otherwise interact with the Airbnb Platform.” To stay on the legal side, choose out of the following options.Special terms. Negotiate a proprietary agreement with Airbnb, authorizing you to use their data.
Publicly available datasets. Download free, anonymized datasets from Inside Airbnb, a non-commercial platform that presents snapshots of Airbnb listings with reviews, calendar and over 50 data points (pieces of information describing the listing.)
If you can’t find a city or region you’re interested in, make a data request for archived or new data. But, in this case, you’ll have to pay for commercial research.The price starts at $375 and may increase depending on the effort involved.
Airbnb instantly purchasable datasets. Buy ready-to-use, structured data from providers such as Airbtics, AirDNA, AllTheRooms, Rabbu, or Mashvisor. Commonly, they offer a year’s to five years’ worth of Airbnb listings which are
- updated on a weekly or monthly basis,
- sorted by zip codes, cities, or countries,
- grouped in a monthly/weekly granularity, and
- organized in the form of csv files.
Booking.com and Vrbo data
Though Airbnb dominates the global vacation rental market, with 59 percent of all home listings appearing on the platform, we can’t ignore its key rivals. Two other large players to be considered are Booking.com and Expedia Group that control 37 percent and 22 percent of the inventory respectively.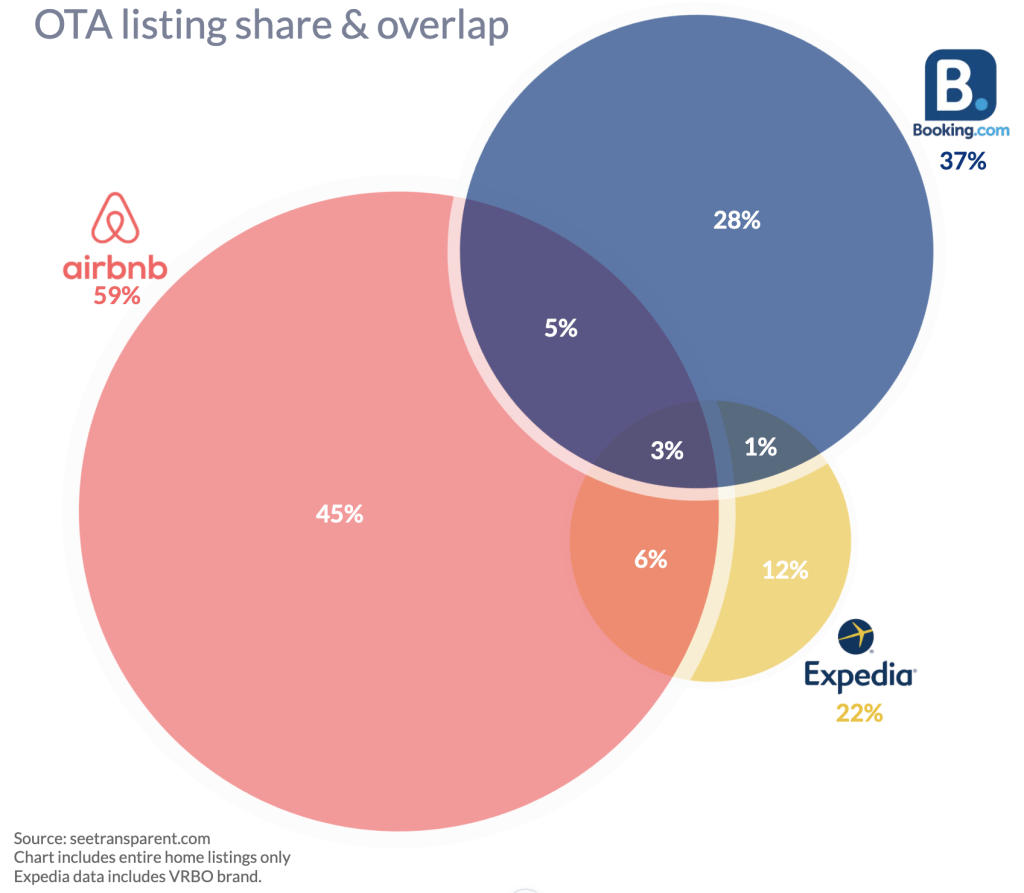
Airbnb vs Booking.com vs Expedia listings share and overlap. Source: Transparent
Booking.com sees vacation rentals as a “growth driver for years to come” and heavily stresses this business direction. Expedia, in turn, owns two popular marketplaces for alternative accommodations — HomeAway and Vrbo (short for Vacation Rentals by Owners) covering 190 countries.Similar to Airbnb, neither of these vacation rental leaders allow data scraping or any commercial use of their content. To access their listing history, you need to contact those companies directly to negotiate private terms.
Some data providers claim to aggregate information from above-mentioned platforms alongside Airbnb and combine it into unified datasets, removing overlap. This includes the above-mentioned AirDNA, AllTheRooms, and Mashvisor.
Short-term rental data attributes: what to look for
Depending on your goals, you may need to analyze different data attributes. Roughly, we can group them as follows.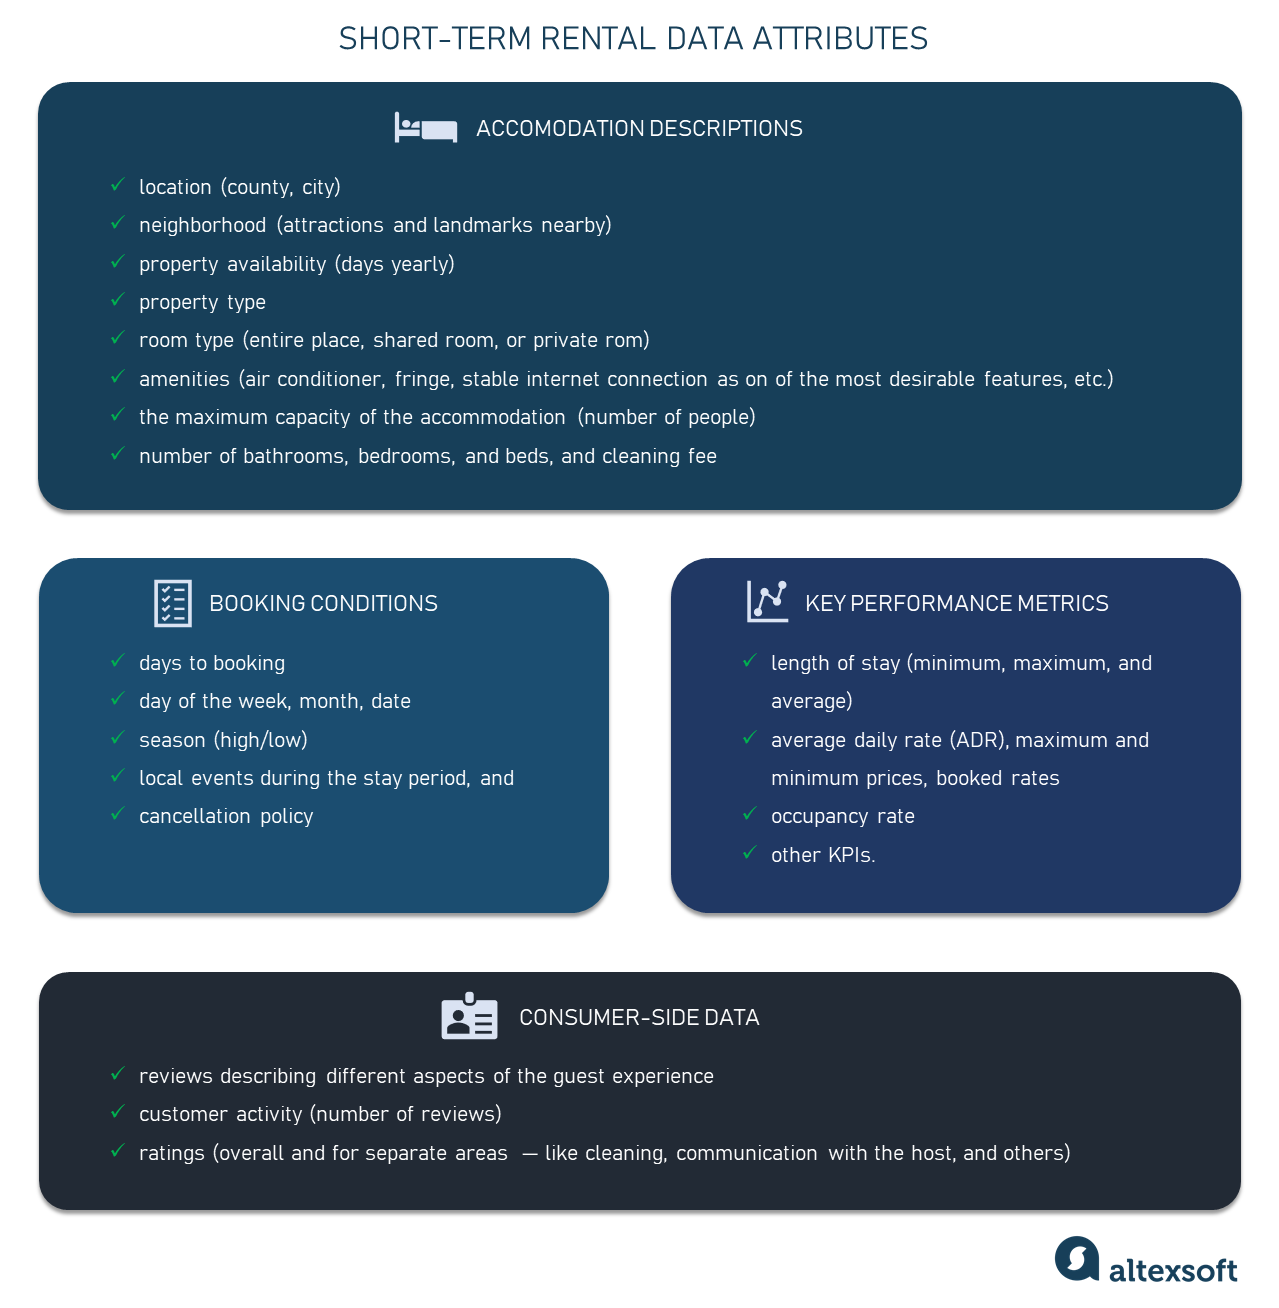
What to look for in vacation rental data.
Accommodation description includes various characteristics of the property, from its location and landmarks nearby to everything related to its type, availability, size, and household amenities.Booking conditions describe when, for which period, and on what terms the reservation was made. Key attributes here are days to booking, dates, season, and cancellation policy.
Key performance metrics in most cases coincide with those used throughout the hospitality business including length of stay and average daily rate (ADR). Yet, for instance, the occupancy rate for vacation rentals is estimated in a different way than for hotels. You need to divide the number of days when the property is booked by the number of days when the property is available.
Learn more about key KPIs used in the hospitality business from our article on how to evaluate your property’s performance.
Consumer-side data embraces information on your property generated by your guests. Reviews describing different aspects of the customer experience, likes and dislikes, ratings, and other types of feedback enable you to find room for improvement.
These are by far not all data attributes associated with vacation rentals. Research projects involving machine learning consider dozens of details to make accurate predictions and valuable insights.
It’s worth noting that vacation rental information is often organized in chronological order, in the form of observations collected over a certain period of time, also called time series. Such a structure allows for tracing trends, cycles, seasonal patterns, and changes in the historical data as well as predicting their repetition in the future.
Now, let’s see how exactly your vacation rental business can benefit from data.
Short-term rental analytics: what questions data can answer
Data can tell you almost everything — if you ask the right questions, have powerful business intelligence tools to derive answers about the current situation, and apply machine learning methods to forecast the future. The quantity of available information and data quality also impact the reliability of the insights.Market research: where is the best place to invest in vacation rentals?
Short-term rental data grouped on geographic location can give you insights into market performance in areas you’re interested in. Another opportunity is to compare information on cities side by side to find the region with the best investment potential and allocate your resources accordingly. Also, such regional data will help you develop a business strategy based on current trends and patterns from previous years.
Top ten best US destinations for vacation rental investments in 2022. Source: AirDNA.
The table above demonstrates that vacation rentals in Hawaii and Tennessee have more to offer investors than Florida. Besides that, the list is clearly dominated by small and mid-sized towns. To evaluate which regions promise the biggest return, AirDNA relied on three metrics.Rental demand. This metric reflects the popularity of vacation rentals in the region during the year.
Revenue growth. The parameter is estimated using two years’ worth of data on change in revenue per available room (RevPAR for vacation rentals in the region. It shows whether properties earn more money than a year before.
Investability. It compares expected income to the cost of purchasing the property. To calculate this metric, subtract the average cost of running the property from the average revenue and divide the result by the average price of similar homes in the same area.
AirDNA combined those metrics with other data points — like the number of short-term rental listings and revenue potential — to calculate the final score and give potential investors a clue as to which regions are likely to generate the highest profits.
Performance evaluation: Is your business doing well?
One of the popular approaches to assessing business performance is to compare your average metrics against those of other vacation rentals in the same or similar locations. When working with Key Data, our data science team used a content-based filtering algorithm to set side-by-side key KPIs of properties on a regional basis.Occupancy rate prediction: How full will your property be?
Occupancy rate is a key indicator of demand for your properties. It depends on the location, season, number of competitors nearby, rate, and many other factors. For property managers, it’s critical not only to consider the metric at the moment and compare it to the industry at large but also to be able to forecast the demand for a month ahead and longer.Let’s again illustrate the above with a real-life example from our collaboration with Key Data. One of our tasks was to develop an occupancy rate predictor for an upcoming month. Our partner provided us with 120,000 time series for vacation rentals and 20,000 time series for areas to train a convolutional neural network (CNN). Though CNNs are mostly known as universal problem-solvers in the field of image recognition, they also proved to be efficient when applied to time series tasks.
But first we had to enhance the precision of data inputs. Observations provided by third-party platforms didn’t take into consideration temporarily unavailable properties. They could be on hold due to repair or cleaning, the owner’s family stays, and many other reasons. Anyway, ignoring this factor skewed the forecast.
To address the problem, our team applied a k-nearest neighbors (KNN) algorithm: It assumes that items located close to each other are likely to be similar. This allowed us to fill missing values using complete observations available for nearby areas. Finally, we managed to enhance prediction accuracy by 16 percent, no matter the region.
Learn more on our cooperation with Key Data Dashboard from the case study Advancing a Business Intelligence Tool with AI.
Setting the competitive price: At what rate will vacation rentals yield the highest revenue?
Studies along with common sense demonstrate that pricing decisions are for the most part dictated by the property type, the number of bedrooms, distance from popular landmarks, seasonality, and rates of regional competitors. Yet, the main key to success is finding the right balance between prices and the expected occupancy rate.Data — if properly and timely processed — allows you to better understand how to adjust rates to demand, proactively react to changing market conditions, and as a result, maximize revenue. Such a flexible approach is called dynamic pricing and is especially effective when backed by ML-driven technologies.
Speaking of practical realization, it took us several steps to put flexible pricing into practice for Rakuten Travel.
- We created a model to predict average prices for similar properties.
- Those average prices were compared against the historical rates of the targeted accommodation. The results were used as additional variables for the next step.
- We developed a price elasticity model to forecast occupancy rate considering multiple factors and, most importantly, price differences.
Learn more on our cooperation with Rakuten Travel from the case study Building an Algorithm to Set Early Booking Prices.
Sentiment analysis: What to improve to make your guests happier?
Consumer-side data like ratings and reviews provide a fertile ground for opinion mining, also known as sentiment analysis. This technique identifies the emotional coloring behind the text with the help of machine learning and natural language processing (NLP) and gives you insight into how your guests perceive their stay at your property.As an experiment, our data science team created an NLP-based application called Choicy. It collects customer reviews from public sources, detects an emotional component behind over 30 amenities, and generates individual ratings for each of them as well as the overall score. The tool helps tourists to make an informed choice about accommodations. At the same time, hosts can use it to see exactly why guests liked or disliked their stay.

Choicy interface with the overall score and individual amenity scores.
A machine learning model behind Choicy was trained on over 100,000 review samples. While the tool was initially designed to analyze hotel reviews, it can be customized for vacation rentals — with some critical amenities like high speed WiFi Internet and kitchen convenience added.Learn more on our work on Choicy from the case study AltexSoft Builds Machine Learning Based Platform to Score Hotel Amenities.
Which data strategy is right for your business
You can never have too much money — and the same goes for data. Yet, to make it really useful, you need to treat it as a valuable asset and invest in data management strategy, expertise, and analytics software.The scale of those investments will depend on your business size. For example, custom development of an ML-based predictor fits large, tech-savvy enterprises but is too costly and makes no practical sense for a host managing several properties via Airbnb. Just for reference:
- 70 percent of vacation rental businesses are considered small, with no more than 19 properties;
- 20 percent are mid-sized, meaning that they operate 20 to 99 properties; and
- 10 percent are large, managing over 100 properties.
Small vacation rental companies: one to 10 properties
If you sell your properties via Airbnb or other vacation rental platform, you can use their native data analytics tools to track your performance metrics. Besides that, all data providers we’ve mentioned in this article offer ready-to-use rental dashboards and general market insights.You can even get started with data analysis for free. Make use of tools like Airbnb data analysis by Rabbu or a basic plan by Transparent, a data intelligence platform that tracks over 35 million listings from Airbnb, Vrbo, Booking.com, and TripAdvisor.