

Occupancy rate is a key indicator of historical, current, and forward-looking performance of a hotel or vacation rental business. Stakeholders — from property owners to property managers to housekeeping staff — use this metric to make informed decisions and increase revenue per room or property.
Read on to find out what occupancy prediction is, why it’s so important for the hospitality industry, and what we learned from our experience building an occupancy rate prediction module for Key Data Dashboard — a US-based business intelligence company that provides performance data insights for small and medium-sized vacation rentals.
What is the occupancy rate and why does it matter?
The occupancy rate in hospitality is the share of occupied hotel rooms or vacation rental units at a given time.
You measure the occupancy rate by dividing the number of occupied rooms by the total number of rooms available. The result is multiplied by 100, showing the percentage of rooms reserved at a specific moment. The same formula goes for vacation rental property management, but instead of rooms, you calculate the percentage of booked vacation rental units.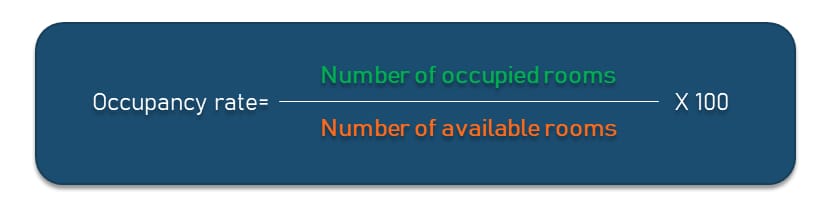
For example, if you run 85 vacation rentals and 70 of them are booked tonight, then tonight’s occupancy rate is around 82 percent (70 divided by 85 and multiplied by 100).
It's a common practice to subtract hotel rooms or short-term vacation rentals that are out of order (e.g., for maintenance or renovation) from the total number of available units to receive a more up-to-date and accurate occupancy rate.
What occupancy rate is considered good?
While occupancy rate is essential for deciding whether your management strategies succeed or fail, there are a few things you should keep in mind regarding this KPI.
If you look at Amadeus' in-depth Demand360® business intelligence data, you’ll see that the average global hotel occupancy rate was nearly 70 percent in the summer of 2022.
You might assume that 70 percent is a low figure that doesn’t bring much profit. After all, it’s not 100 percent. But let’s consider it in context.
First of all, this is an increase of around 5 percent over the summer of 2019: It’s already an indicator that things are going pretty well. Overall, average hotel occupancy rates range between 65 and 80 percent.
Secondly, having all your units booked doesn’t mean maximized revenue earned. Chances are, you won’t get a 90 or 100 percent occupancy rate without lowering your rates. There are many cases when a hotel manager or a vacation property renter can earn more money with lower occupancy by increasing rental fees. Not to mention that it’s advantageous to have some units available for last-minute guests.
So, when using the occupancy rate, you should be careful with it and take into account other measurements to get a fuller picture.
Why track occupancy rate?
Along with other hospitality metrics like RevPAR, the occupancy rate is an important KPI that allows better and more accurate revenue management aimed at maximizing income. Hotel owners and property managers can adjust their revenue strategies based on the occupancy changes that took place or are predicted and expected.


Check our video on how revenue management works in hospitality
A simple KPI, the occupancy rate allows you to understand how your business is performing against competitors and its own historical data at different periods. Having this knowledge under the hood, you will be able to set rates accordingly, predict your guests’ stay patterns, plan maintenance, and schedule enough staff.
For example, you may find that your accommodations are most popular during the winter holidays or when a science conference occurs nearby. Whatever the case, you will have a bigger picture of your hotel or vacation property performance and make more informed decisions.
Occupancy rate prediction challenges
In hospitality, if you want your revenue management to be successful, you have to be able to accurately make demand forecasts.
But don’t get out Tarot Cards and light the candles ????
Ways to predict future demand for hotel rooms or vacation rental properties
Instead, you can opt for predictive analytics to identify patterns that are likely to develop again in the future and estimate a probable demand for hotel or vacation rental properties. This will allow you to dynamically optimize the pricing policy and sell your units at reasonable prices.
To achieve all of this, though, both current and historical data are important. On top of that, occupancy rates fluctuate widely depending on different factors that can be internal and external.
Internal factors include
- hotel or property location,
- number of hotel rooms or rental facilities, and their size,
- room or property facilities,
- prices,
- service quality,
- current market demand,
- seasonality, and
- holidays, to name a few.
External factors include
- economic changes,
- events (sports competitions, concerts, big MICE events),
- exchange rates,
- political situations, and
- competitors’ pricing.
Also, keep in mind the differences between occupancy rate prediction for vacation rentals and hotels. When it comes to hotels, it is important to forecast room occupancy for every night. Vacation rentals and other alternative accommodations have a slightly different nature: They don’t depend on daily bookings so heavily. Instead, it makes more sense to perform long-term predictions — for weeks or months.
Keeping track of data, looking at the impactful factors, and doing all the occupancy rate calculations manually is a difficult and time-consuming task, especially if you are new to this business. But despite the obvious difficulties, you can’t just entrust the fate of your business to pure guesswork. To determine when occupancy will be higher or lower and what prices should be considered for a given period, you can take advantage of machine learning powered by data.
So how exactly are occupancy rate prediction tools built?
Dataset preparation and construction
The starting point of any machine learning task is data. A lot of data, to be exact. A lot of quality data, to be even more exact.
To learn the basics, you can read our dedicated article on how data is prepared for machine learning or watch a short video.

Data preparation in 14 minutes
As of now, we’ll focus on such steps as finding the right data and constructing the dataset to build an ML-powered occupancy rate prediction module.
Data sources
Occupancy prediction models are developed using lots of data collected from various sources. Regarding the amount of data, here is the rule “the more the better.” Of course, you can’t neglect the quality, but the quantity is important. “To achieve high accuracy of predictions, it’s better to have at least several years of historical data collected,” says Maryna Dorosh, a Machine Learning Engineer at AltexSoft.
The next question: Where to get enough valuable data to build a predictive model? There are a few options.
Hotel or vacation rental software. The most reliable sources of booking information are property management systems (PMSs), channel managers, and websites allowing direct booking. Such systems have all the reservation details including occupancy information and rates at which a certain room or accommodation was booked at a given period.
Since the hotel or vacation rental software is limited to the inventory they sell, it might be useful to look for third-party platforms that aggregate historical and current data from different sources. These can be OTAs, online marketplaces, and data providers. With this approach, you get a more complete picture, track market trends, and analyze competitors.
Hospitality data providers. There are various information providers that bring all hotel and vacation rental data into one place. By making use of their services, you can spend less time gathering the right data and focus on building the model. For example, our client — Key Data — is a data provider that focuses on short-term rentals.
When developing an AI-driven forecasting tool for Key Data, our team leveraged more than two years of historical data that our client sources from over 700 partner PMSs of vacation rental businesses, tourism groups, and destination management companies.
OTAs and online marketplaces. Obviously, OTAs like Booking.com and online home-sharing marketplaces like Vrbo and Airbnb accumulate a huge amount of hotel and vacation rental data that can be useful for various analysis tasks. Airbnb alone contains over 7 million active listings of short-term homestays from 220 countries as of 2022. By the way, you can watch our video about this service.

How Airbnb creates the future of travel
Please note. In most cases, to stay on the legal side, you can either purchase available datasets or negotiate an agreement with the company providing you with official access to the information.
Public datasets. You can also take advantage of publicly available datasets — for example, Hotel booking demand on Kaggle. This dataset contains booking information for a city hotel and a resort hotel and can be downloaded as a CSV file from the website. Also, there are free, anonymized datasets from Inside Airbnb, a noncommercial platform that presents snapshots of Airbnb listings with reviews. But keep in mind that such datasets are commonly small and hardly contain enough features to train a good model. Look for more info about the best public datasets for machine learning in our article.
Occupancy rate dataset structure
Once the data source is chosen, you should consider what parameters will constitute variables in your occupancy rate forecasting model. As an example, we can take the previously mentioned Kaggle dataset that contains about 12,000 records about bookings made in a resort hotel and a city hotel over the period of 2015 to 2017.
This dataset includes various booking information such as
- values indicating whether the booking was canceled,
- when the booking was made,
- length of stay,
- number of stays on weekends,
- market segment through which a room was booked, and
- country of origin, among other things.
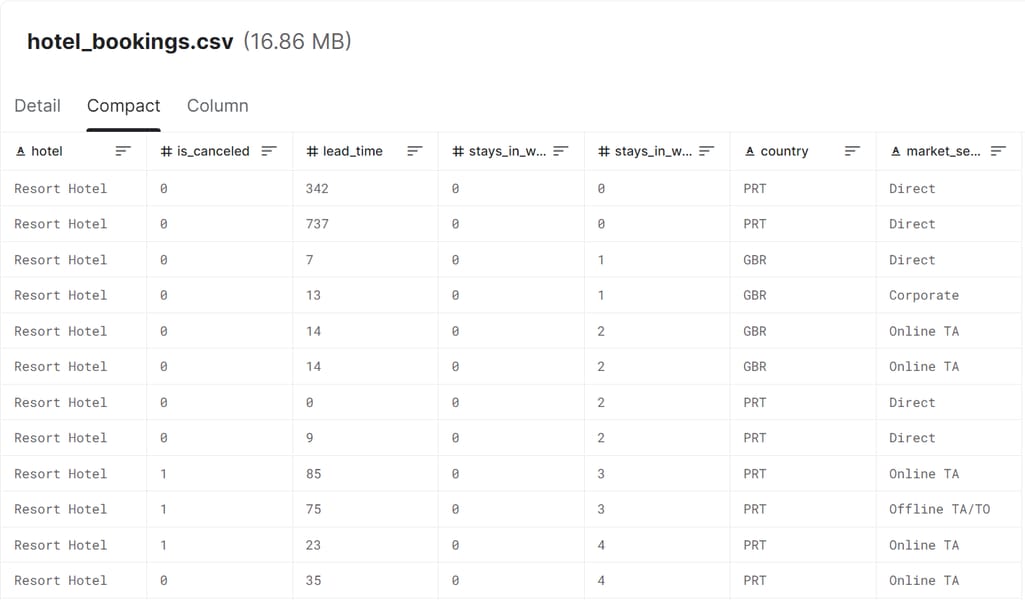
The section of the hotel booking demand dataset on Kaggle
When building an AI feature aimed at more precisely analyzing occupancy rates for Key Data, we tried to single out all important features in historical data. They can be grouped into the following categories:
- booking history for a large number of instances, including bookings with real sales;
- history of price changes (how property rates changed and what factors affected those fluctuations);
- geographic locations of vacation rentals and booking statistics for a certain area;
- seasonality (whether it was high or low season);
- general market information with competitor prices; and
- holidays and vacations (including school breaks).
While not so impactful in the vacation rental sphere, the behaviors of customers who prefer hotels may be greatly affected by major cultural, entertainment, or sports events. So, you may want to include them as additional features in your dataset.
Data gaps
When you take historical data containing a wide array of instances over the years, there will always be gaps in data. Basically, there’s little to no chance for you to have booking information for every day of the year for every hotel room or short-term accommodation.
When building our model, the problem with the dataset was that it didn’t cover all the geographical locations of the US. To fill in the missing pieces of puzzles, our client took the data from their partners. However, there was no information about temporarily closed rentals. To deal with this issue, our data scientist included information from the neighboring areas, where the client had data directly from PMSs.
With this approach, we managed to receive consistent data sequences — or time series — to train a model on.
Machine learning models to forecast occupancy rate
Occupancy rate prediction is a typical task of time-series forecasting — a set of methods in statistics and data science aimed at observing variables in historical data from the time perspective, understanding the shifts in demand patterns, and determining how the variables may change in the future considering the captured patterns.
When it comes to time-series forecasting of occupancy rates, you mainly want to know what will happen to your occupancy indicators in a day/week/month/year, etc. For example, how many rooms or properties will be booked in the next year based on the booking data from corresponding periods in the previous years? This will allow you to quickly identify trends: periods of increased or decreased interest in the offer or months in which rooms were sold at a higher or lower price.
In dealing with occupancy rate sequential data, different machine learning algorithms (mainly deep learning networks) can be used to provide accurate predictions. We’ll overview the key techniques along with the ones chosen by our data science team.
Recurrent neural networks
A Recurrent Neural Network (RNN) is a powerful, robust type of neural network with internal memory: It has sort of looped connections, meaning the output of a certain neuron can be fed back as an input. Having cycles inside, an RNN can be represented as many copies of the same neural network, where each copy transmits a message to the next one. The decision is made with consideration of both the current input and the output learned from the previous input.
Since RNNs can remember important things about the input they receive, they can accurately predict what will happen next. This is why they are often the algorithm of choice for time series data — in our case, showing the change of occupancy rates throughout a certain period of time. Recurrent neural networks can form a much deeper understanding of a sequence and its context compared to many other algorithms.
The drawback of this technique is that the internal memory is short. Simply put, RNNs “forget” what happened several inputs before and therefore fail to work with long data sequences.
Long short-term memory networks
A long short-term memory (LSTM) network is one of the types of recurrent neural networks. Unlike their ancestors, which can process only short sequences, remembering information for long periods of time is a normal behavior of LSTM models: It’s not something they struggle to learn.
The memory area of LSTM networks is composed of so-called gates.
- The forget gate decides when to "forget" the contents of the long-term state vector.
- The input gate decides when information from a simple recurrent neural network should be added to the long-term vector.
- The output gate decides which part of the long-term state vector should be passed to the next step.
In layman’s terms, the LSTM model has the power to choose whether to keep a certain feature in memory or delete it. While advanced, this model also struggles with very long sequential data. Not to mention that it requires a lot of tuning to be done as any other ML algorithm.
Convolutional neural networks
A Convolutional Neural Network (CNN), sometimes called ConvNets, is a neural network consisting of multiple layers with neurons that can process data and extract features from it automatically.
The name of the network architecture comes from the presence of the convolution operation — each data point is multiplied by the convolution matrix (kernel) element by element and the result is summed up and written to a similar position in the output.
How convolution operation works. Source: Medium
Convolutional neural networks are mainly multidimensional and are used for pattern recognition in images. However, one-dimensional convolutions can be helpful for time-series data to extract information along the time dimension.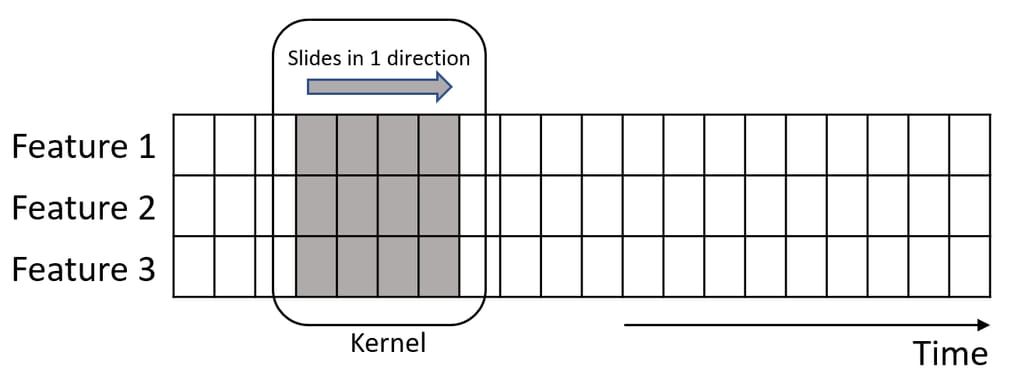
Convolving features on a time dimension. Source: Macnica
Instead of extracting spatial information, you use 1D convolutions to extract information along the time dimension. Say you have occupancy rate as one feature, pricing as a second feature, and property type as a third feature. These features create one vector that slides in one direction with the same time steps.
CNNs do not have memory. But when composing many layers, it turns out that the upper layers see most of the sequence, so convolutional neural networks can cover long patterns. That was one of the reasons our team went with this model.
The feature our team worked on allows for predicting occupancy rates in rentals in different areas for an upcoming month. To enable this functionality, our data scientist applied a CNN-based time-series model, trained on historical data with 120,000 series for properties and 20,000 series for areas.
Another reason for choosing CNNs was their ability to develop an internal representation of any data, even if it’s a one-dimensional sequence. Thanks to this ability, the model could learn the patterns within the time window, which was helpful since we had missing data.
Moving towards better accuracy
Predictive models can be reasonably good at foreseeing the future but they fall short when it comes to such phenomena as pandemics or natural disasters. No one could predict Covid-19, let alone all the ways it influenced the travel industry. Naturally, all the prediction tools built before the hit of the global pandemic must be adjusted given new data.
The message here is as follows: Even if you have an occupancy rate predictor in place, you still need to work on its improvement. In case it’s only at the planning stage, make sure you have relevant data. Training a model on booking information that doesn’t cover the period after 2019 won’t make much sense.
At the same time, we’d like to point out that there’s no perfect model that can fit all situations. The methods described here are just a few out of many that you can use for occupancy rate calculation. And they don’t necessarily have to be complex. In many cases, simpler models like LightGBM or ARIMA can provide decent results. You can try different approaches and use machine learning metrics to evaluate their performance to see what works better for your particular use case.