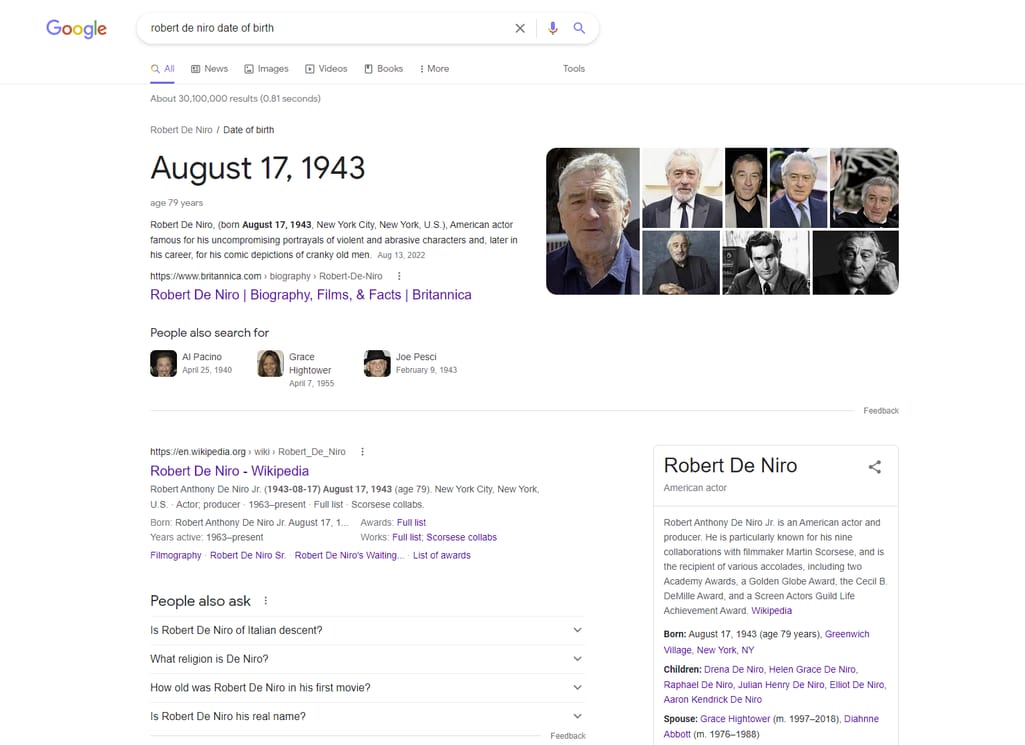
If you’ve ever used a search engine to find out more about one of your interests and you’ve seen something like this…
Google results for the query “Robert De Niro date of birth”
…then you’ve already crossed paths with the star of our article — a knowledge graph.
As a digital representation of a network of real-world entities, a knowledge graph is the foundation of search engines or question-answering services. Like with our example above. You see data that is directly related to the “Robert De Niro date of birth” search query — such as his age. And it looks so natural for the user’s eye to find additional info, including his place of birth, the actors he appeared with, and his spouse on the SERP without having to go any further…
However, it ain’t that easy for the search engine — Google in our case. To make such things happen, it had to go through many websites, find relationships between the information presented there, and finally serve useful data with great precision and speed. And what made all of these things possible? Right, knowledge graphs.
Our article about a data fabric partially touched on knowledge graphs. This post aims to dive deeper into the topic and give a complete picture of what knowledge graphs are, their components and concepts, and how businesses can use them for better decision-making and growth. So, if you want to apply this technology in your projects but have no idea where to start, this post is a great place.
What is a knowledge graph?
A knowledge graph is a way to integrate data coming from a variety of disjointed sources in the network that connects different data entities — objects, people, events, situations, or abstract concepts — and depicts their semantic relationships.
Depending on the relationships between entities, they form classes organized into a hierarchical structure. For instance, if you work with business information, Person, Organization, and Location can be classes. A particular worker or customer will belong to the class Person.
Basically, a knowledge graph is obtained in the process of filling ontologies with instances of real data.
Due to the fact that every company or even individual creates their own version of knowledge graphs, you won’t find a single standardized definition.
People explaining knowledge graphs be like… ????
For example, Heiko Paulheim — a Professor of Data Science at the University of Mannheim, Germany — argues that “a knowledge graph primarily describes real-world entities and their interrelations organized in a graph that defines possible classes and relations of entities in a schema, allows for potentially interrelating arbitrary entities with each other, and covers a variety of topical domains.”
Scientists Lisa Ehrlinger and Wolfram Wöß say that knowledge graphs are nothing but “semantic representations of knowledge that don’t necessarily have a graph structure.”
Whatever the definition, the knowledge graphs didn’t just appear out of nowhere. The history of how all cool stuff emerged and developed deserves special attention. So, before we jump into the ocean of information about knowledge graphs, their components, and their applications, let’s look at the origins.
The origins of knowledge graphs
Knowledge graphs as we know them now have more than 10 years of development history. Probably the biggest value is brought by knowledge graphs specific to individual subject areas. But to understand their essence better, we will consider general-purpose graphs.
DBpedia. The basics of knowledge graphs open to users were first implemented in 2007 when the DBpedia knowledge base was created as a result of the semantic processing of the Wikipedia article on infoboxes.
YAGO. In 2008, the Max Planck Institute for Computer Science in Saarbrücken developed YAGO — an open-source graph. Its distinguishing feature is the use of the WordNet semantic thesaurus and an impressively detailed entity class hierarchy. YAGO currently contains about 120 million facts about different world entities.
Google Knowledge Graph. The Google Knowledge Graph first saw the world in 2012 and it significantly increased the interest of the academic and business communities in representing knowledge in graphs, coining the term “knowledge graph,” and setting the trend for the coming years.
Wikidata. While DBpedia uses Wikipedia data to enrich the graph, the Wikidata graph developed and launched in 2012 is designed to store knowledge that will be used already in Wikipedia (mostly for filling infoboxes and tables on the page) in many available languages. Wikidata uses an advanced knowledge modeling approach to describe entities and relationships in more detail. Wikidata currently contains over 95M entities or nodes with semantic relations between one another. There are millions of such interconnected triples out there.
Knowledge graphs available on the Internet form a Linked Open Data Cloud (LOD Cloud), semantically combining published graphs into one giant network. And if in 2007 this cloud consisted of only 12 graphs, as of May 2020 it had grown to 1255 graphs in nine different domains.
As of now, the study of knowledge graphs stands at the junction of many areas of computer science:
information retrieval, which allows you to speed up the filling of the graph from various sources;
natural language processing (NLP) and semantic technologies that allow for describing and using the meaning of the stored knowledge in the analysis;
data management systems, providing efficient storage of graphs; and
machine learning, allowing for analyzing the knowledge contained in the source data and generating new knowledge.
You might have noticed that here we used such words as “nodes” and “triples.” They require further explaining, so we’re moving to the next interesting paragraph explaining the key component of any knowledge graph.
Knowledge graph components
In its simplest form, a knowledge graph is a directed labeled graph that comprises three elements:
nodes — real-world entities that can be both material things and abstract concepts;
edges — links that connect the nodes; and
labels — attributes that define the relationships between the nodes and reasoning rules on edges.
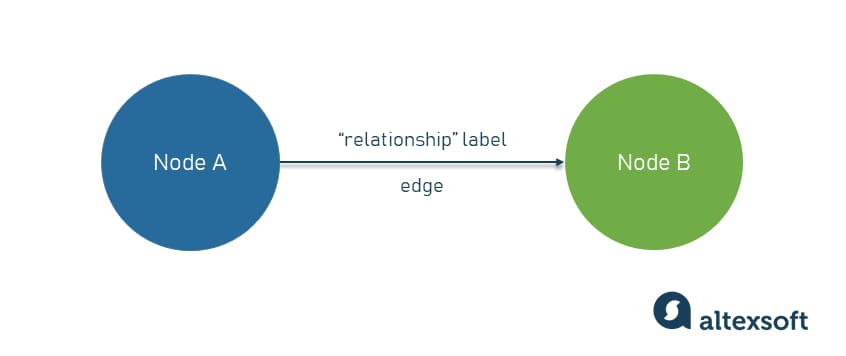
The most basic knowledge graph with 2 nodes and one edge
A triple is the most basic knowledge graph model you can build with two nodes and one edge explaining their connection. Often, the triple is shown as either “subject-predicate-subject” or subject-predicate-object.” That is, an entity (subject) can be associated with another entity or with a simple value (an object) through some property (a predicate).
For example, the triple “Columbia University is located in NYC” connects the subject “Columbia University” and the object “NYC” using the “located in” predicate.
These triple models are defined by RDF (Resource Description Framework) — a general method of describing data interchange on the Web. It was developed and standardized by the World Wide Web Consortium (W3C).
The logical basis of RDF is extended by related standards RDFS (RDF Schema) and OWL (Web Ontology Language). They allow for representing various types of data and content (data schema, taxonomies, vocabularies, and metadata) and making them understandable for computing systems.
But let us explain a knowledge graph and its components using our Robert De Niro example from the intro.
A knowledge graph example
So, in terms of a “graph of data,” a dataset is arranged as a network of nodes, edges, and labels rather than tables of rows and columns.
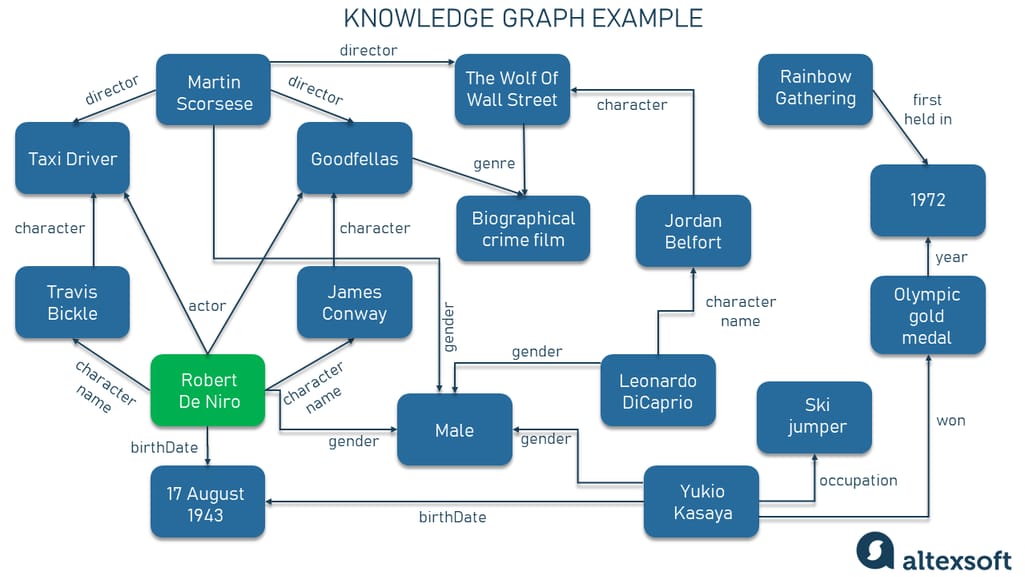
Knowledge graph example
If Node A (our starting point) is “Robert De Niro” and Node B is “17th of August, 1943,” then the edge and the label will be “birthDate” respectively. This is our first triple.
We can also see nodes such as “Travis Bickle” and “James Conway” connected to the node of “Robert De Niro” with edges providing semantic information that he played these two characters.
The relations to the “Martin Scorsese” and “Leonardo DiCaprio” nodes are on the surface too since these people are all in the filmmaking industry, they worked together on some films, and besides they are all males.
But if we put Robert De Niro, an actor from the US, and Yukio Kasaya, a former ski jumper from Japan, in one line and told you that they are linked somehow, you probably wouldn’t trace the connection at first glance without a graph. However, there’s a relation — these two people share the same birth date.
At the same time, Yukio Kasaya has nothing to do with the Rainbow Gathering, but these nodes are related to the year 1972 when our ski jumper won the Olympic Gold Medal and the aforementioned counterculture festival was first held in Colorado.
That’s how we can get from Robert De Niro to aging hippies. Funny, huh?
While it’s definitely exciting, you still need more info on why you should care about knowledge graphs.
General scenarios of using knowledge graphs
Knowledge graphs put data in context via linking and semantic metadata and in this way provide a framework for data integration, unification, analytics, and sharing. There are numerous applications of knowledge graphs both in research and industry as they are one of the best and most flexible ways to represent data. Graphs have great expressive power, meaning that they can be used to represent a large number of systems, subjects, and objects in various industries.
Knowledge graphs for organizing data over the internet
Perhaps the most popular scenario at the moment is the enrichment of Google search results using the Google Knowledge Graph. As we presented above, when searching for people, general information about them (if available in the graph) is displayed in a separate infobox. When searching for restaurants, the location, the expected cuisine, and the approximate price of a meal are displayed. In addition, the search engine can answer simple factual questions: when a certain person was born (see again our Robert De Niro example) or where a certain place is located.
Knowledge graphs for building personal assistants and chatbots
More complex natural language questions can be answered using DBpedia or Wikidata graphs when the original query is parsed to find the entities described in the graph. As a result, a combination of entities and relationships forms a set of subgraphs, some of which may contain an answer. These subgraphs are rewritten into a graph query in a formal language (for example, in SPARQL) and the correctness of the result is evaluated.
Amazon Alexa, Google Assistant, and Apple Siri chatbots have their own knowledge graphs that help answer a wide range of questions from geolocation, for example, to find nearby restaurants or historical information about any location, to real estate and medical inquiries.
Knowledge graphs for enterprise data integration
Bringing data together from heterogeneous enterprise sources and creating a unified view of that data is a popular application of knowledge graphs. This is especially useful for big enterprises when the sources are presented in different formats (CSV, XML, JSON, relational databases) and use different data schemas.
In this case, knowledge graphs can serve as a universal means of communication and integration of this data, both
physically — when the data and schema are converted into a single RDF representation and
virtually — when the data remains in its original formats, but the knowledge graph integrates the original datasets at the level of abstract schemas (see our article about data fabrics).
For integration purposes, such platforms as PoolParty Semantic Suite from Semantic Web Company or data.world with their data fabric solution allow for creating and managing enterprise knowledge graphs collected from relational databases or semi-structured sources.
AI applications of knowledge graphs
The use of knowledge graphs has become widespread in machine learning too. Graph technologies are the basis for creating intelligent applications that allow for making more accurate predictions and faster decisions.
In the real world, most data is unstructured data, e.g., text, images, audio, and video. While graph databases can store such data, there’s a problem with using them for machine learning tasks. You need to transform the space in which the graph is located into another space for machine learning — a vector space where you can apply ML algorithms like node2vec or GraphSAGE. This transformation is done using a complex property vector extraction methodology called knowledge graph embedding.
Graph embeddings are the representation of nodes and relationships in a graph as vectors with numerical values that a model will be able to understand. Some attributes of nodes, edges, and relations can be selected as vector values. Depending on the task, these properties or attributes of nodes and edges can be different.
For embedding purposes, there is an array of available methods to use, including DeepWalk (word2vec), Node2Vec, and 2D CNN. Graph Convolutional Networks, in turn, can work directly with graphs as inputs.
Graphs are at the heart of a wide range of artificial intelligence (AI) use cases, from drug development to social media friendship recommendations. Here are the key ones.
Fraud prevention in finance and banking
Knowledge graphs are often used to create Know Your Customer (KYC) guidelines. These standards are necessary for protecting financial institutions against fraud, corruption, money laundering, and terrorist financing. Having a complex semantic network under the hood allows banking institutions to understand different ways money flows through their clientele, detect non-compliant customers, and prevent the occurrence of fraud.
One of the leading investment banking firms — Goldman Sachs — uses knowledge graphs to analyze transactions and customer behavior as well as to detect fraud and financial crimes.
Drug discovery in healthcare
Knowledge graphs have proven to be an effective way of finding insights and hidden correlations between genomic, biomedical, and molecular data and optimizing decision-making in the healthcare industry. In this way, pharmaceutical or biotech companies can analyze, classify, and find new potential drug targets and applications.
For example, the pharma giant AstraZeneca has been applying knowledge graphs for drug discovery tasks along with its partner BenevolentAI since 2019.
Recommender systems in entertainment
Since knowledge graphs enable you to find relations between entities that, at a first glance, have nothing in common, there’s no chance they could be avoided by companies using recommender systems. Graph neural networks can process more complex user queries, find hidden patterns, and provide more accurate recommendations to users.
For example, Netflix uses a predictive knowledge graph as a basis for its recommendation engine. In their blog, they say, “The real power of the graph is the information contained in the relational structure. At Netflix, we apply this concept to the knowledge contained in the content universe.”
Targeted news feed in social media
Of course, knowledge graphs have a wide array of applications in the social media world. Facebook’s Entities Graph counts more than 1 billion monthly active users, 600 million of whom log in every day. It maps users’ social connections and these meaningful data connections to derive insights into preferences so it can deliver targeted content to user news feeds.
So, knowledge graphs make it possible to model abstract logical statements and schemes and to fill them with specific objects in the real world. Moreover, knowledge graphs allow machines to reason and infer new knowledge not previously described in a graph. The formal semi-structured model, flexibility, and a powerful logical apparatus distinguish knowledge graphs from traditional relational databases, which are structured, meaning they are inflexible and have predefined connections and relationships.
The future of knowledge graphs
Summing things up, it would be logical to ask the question, “What does the future hold for knowledge graphs?”
The authoritative analyst firm — Gartner — has included knowledge graphs in its "Top 10 Data and Analytics Technology Trends for 2021." The report says, “D&A leaders rely on graphs to quickly answer complex business questions which require contextual awareness and an understanding of the nature of connections and strengths across multiple entities.” With that in mind, Gartner expects that nearly 80 percent of all data and analytics innovation will include knowledge graphs by 2025.
In one of the market reports, PwC indicated that almost all the world's largest companies are engaged in the construction and application of knowledge graphs to one degree or another. The companies range from technology giants like Apple and Google to financial conglomerates to local enterprises.
And this means that the need for technologies built around knowledge graphs and experts in this field will definitely grow.
Such technologies include DBMSs for storing graphs and ways of processing queries, systems for integrating data that use knowledge graphs (like data fabric), interactive systems based on knowledge graphs, and business intelligence systems.