Is EBITDA, the go-to metric for assessing profitability, misleading investors in the travel industry? Unlike EBITDAR, it ignores the massive impact of lease obligations—something that can significantly distort the operational efficiency of airlines and hotels.
In this post, we compare EBITDA and EBITDAR and discuss which one is a better measure for the travel sector.
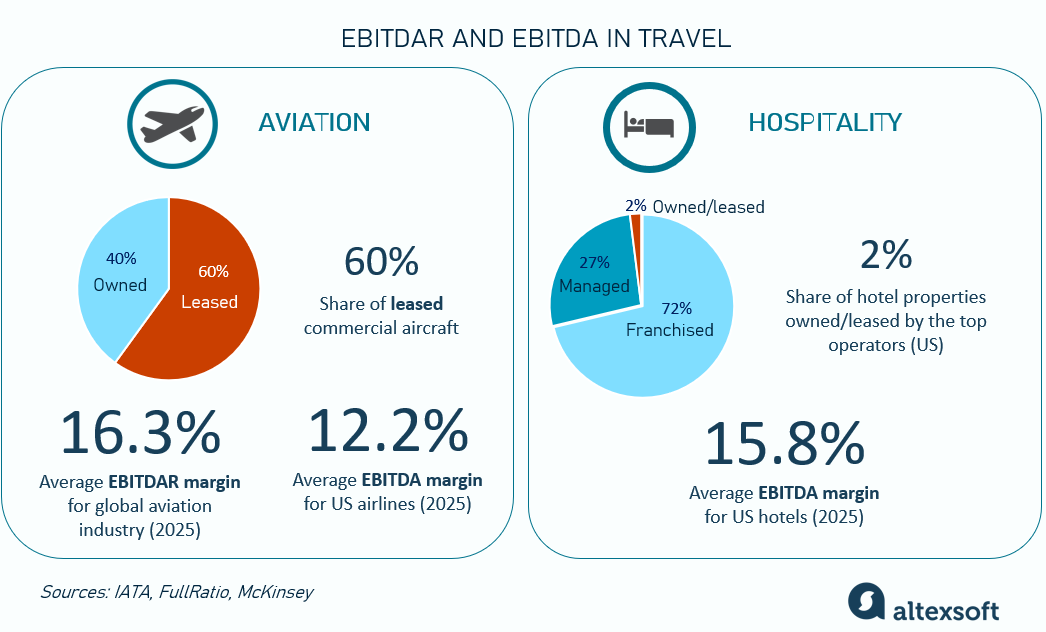
EBITDAR and EBITDA in travel
What is EBITDAR?
EBITDAR stands for Earnings Before Interest, Taxes, Depreciation, Amortization, Rent and/or Restructuring costs.

Analysts and investors use it to assess a company's profitability, evaluate its operational efficiency, and compare financial performance across companies or industries.
EBITDAR is a metric similar to EBITDA, so let’s take a look at it as well.
EBITDAR vs EBITDA
EBITDA means Earnings Before Interest, Taxes, Depreciation, and Amortization. EBITDAR is frequently used in financial analysis to assess operational profitability and compare companies with varying fixed costs.

These metrics help assess cash flow since they exclude non-cash D&A expenses, which are more relevant to long-term capital expenditure than day-to-day operations.
Also, both metrics deduct taxes and interest because these costs are related to the company's financing and tax structure, which can vary greatly in companies and industries.
However, EBITDAR goes one step further and also adjusts for rent and restructuring expenses.
It’s also important to note that both EBITDA and EBITDAR are non-GAAP metrics, meaning that they are not defined by generally accepted accounting principles (GAAP). So public companies are not required to disclose them. And even if they choose to, the calculation method may vary.
EBITDAR margin and EBITDA margin
Both EBITDA and EBITDAR are usually used alongside relevant margins to make comparisons easier.

The margins shift the focus from absolute numbers to relative numbers, helping compare the performance of different-size companies. By using margins, analysts and investors can assess how efficiently a company generates earnings in relation to its revenue, regardless of its scale or total revenue.
Why use EBITDAR?
While EBITDA is a more popular metric overall, EBITDAR is often more preferred in lease-heavy sectors. It provides a clearer picture of operational performance when comparing businesses with high or varying rent costs (airlines, hotels, casinos, retail, transportation businesses, etc.) or when companies have had non-recurring restructuring expenses.
The idea is that rent and one-time restructuring costs aren't part of regular operations, so removing them gives a better view of how much cash a company makes from its core business.
In some cases, EBITDAR can differ significantly from EBITDA. Here’s an example of PENN Entertainment, Inc., a company that operates 43 properties in the US. In its earnings report for the full year 2024, we can see that EBITDA was $165.2 million, but with rent expenses of $155.5 million added, EBITDAR was $320.7 million – almost twice as large.

PENN Entertainment 2024 earnings report
This example shows how vital rent expenses can be for lease-heavy businesses. So, let’s examine each travel sector separately and drill down into its financial metrics.
EBITDAR in the airline sector
Airlines are perhaps the clearest example of why EBITDAR is used. They typically have massive fixed lease obligations – from aircraft to airport gate and facility leases.
According to IATA, around 60 percent of global commercial aircraft are leased.
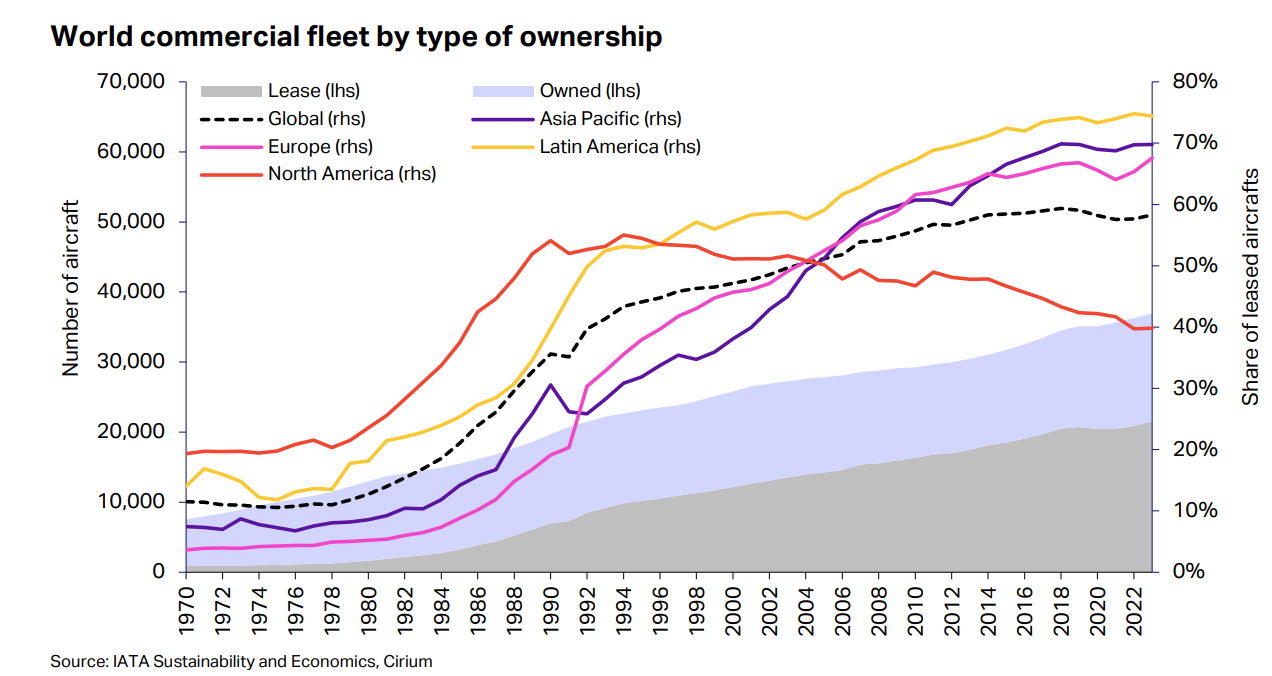
The type of fleet ownership dynamics. Source: IATA
The approach to fleet management varies among regions and types of carriers. Generally, airlines from Latin America (e.g., Aeroméxico) and Asia Pacific (e.g., Air China) predominantly use lease agreements. Similarly, most low-cost carriers (LCCs) such as IndiGo (which leases 75 percent of its fleet), Volaris, Wizz Air, and AirAsia rely heavily on leasing.
In contrast, some airlines, like Ryanair, Delta, Lufthansa, and Southwest, prefer to purchase or finance their planes through debt.
Logically, substantial rent obligations can lead to significant differences between EBITDA and EBITDAR. Under EBITDAR, the airline’s profitability could appear stronger than it actually is because the rent expenses are excluded. Here’s the industry statistics from IATA.
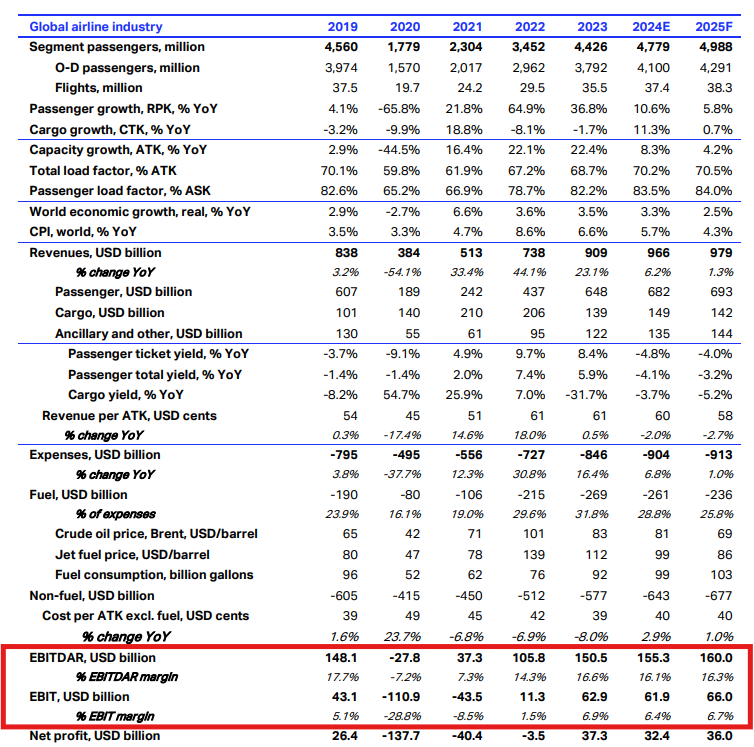
Global airline industry performance. Source: IATA
It accounts for EBIT (Earnings Before Interest and Taxes) and EBITDAR only, but as you can see, the share of this DAR is massive. In some cases, like in 2021, after the pandemic slowdown, it was enough to show profit when, in reality, the bottom line was negative.
FullRatio reports that the average EBITDA margin for US airlines in mid-2025 was 12.2 percent. Comparing it with IATA figures won’t be accurate, but it can still give an idea of how different expense categories impact airline income.
Industry use cases
Here are some examples from specific companies.
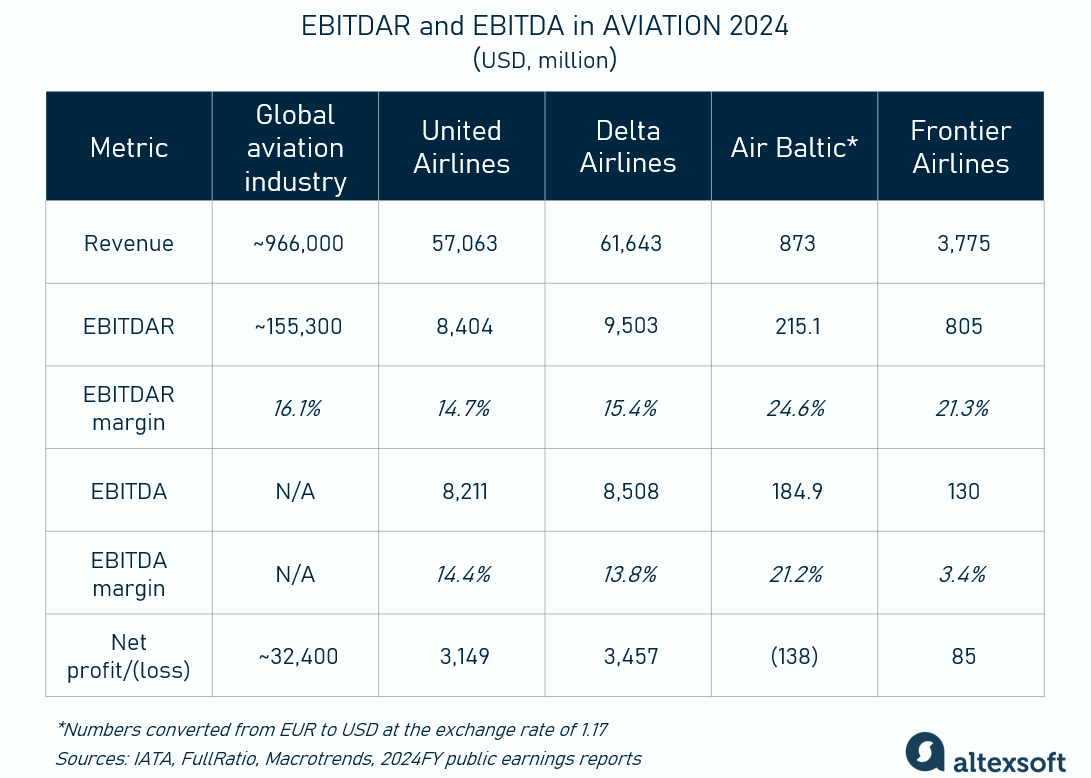
EBITDAR and EBITDA in aviation
The United Airlines earnings reports include both metrics. A minimal difference between them reflects the fact that the carrier does not lease a large portion of its fleet.
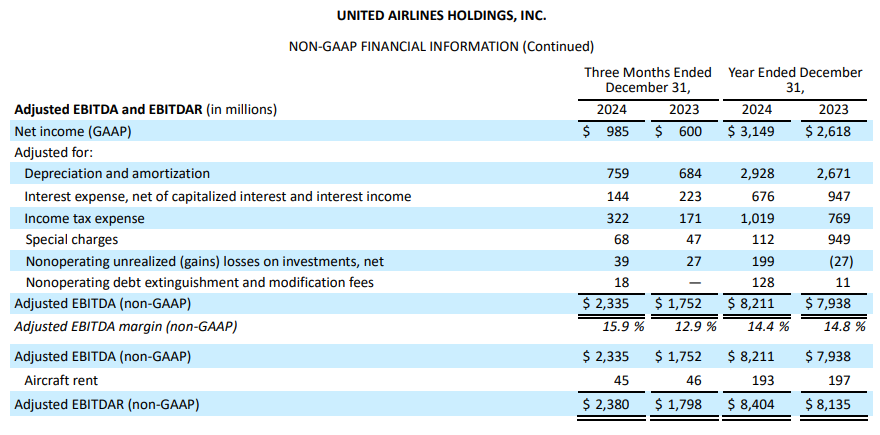
United Airlines 2024 earnings report
Delta Airlines only reports EBITDAR, which was $9.5 billion in 2024. Analysts estimated EBITDA of the same period to be $8.5 billion, which also shows us that the carrier doesn’t lease many of its aircraft.
Air Baltic mentions both EBITDA and EBITDAR in its reports. Since it primarily owns its fleet, the difference isn’t too big. Notably, these metrics show a positive operational result despite the net loss.

Air Baltic 2024 earnings report
Mesa Air Group reported adjusted EBITDA for fiscal full-year 2024 to be $55.5 million and adjusted EBITDAR to be $63.3 million.
In contrast, here are the Frontier Airlines 2024 results. We can see how drastically EBITDA differs from EBITDAR, reflecting the massive share of aircraft rent.
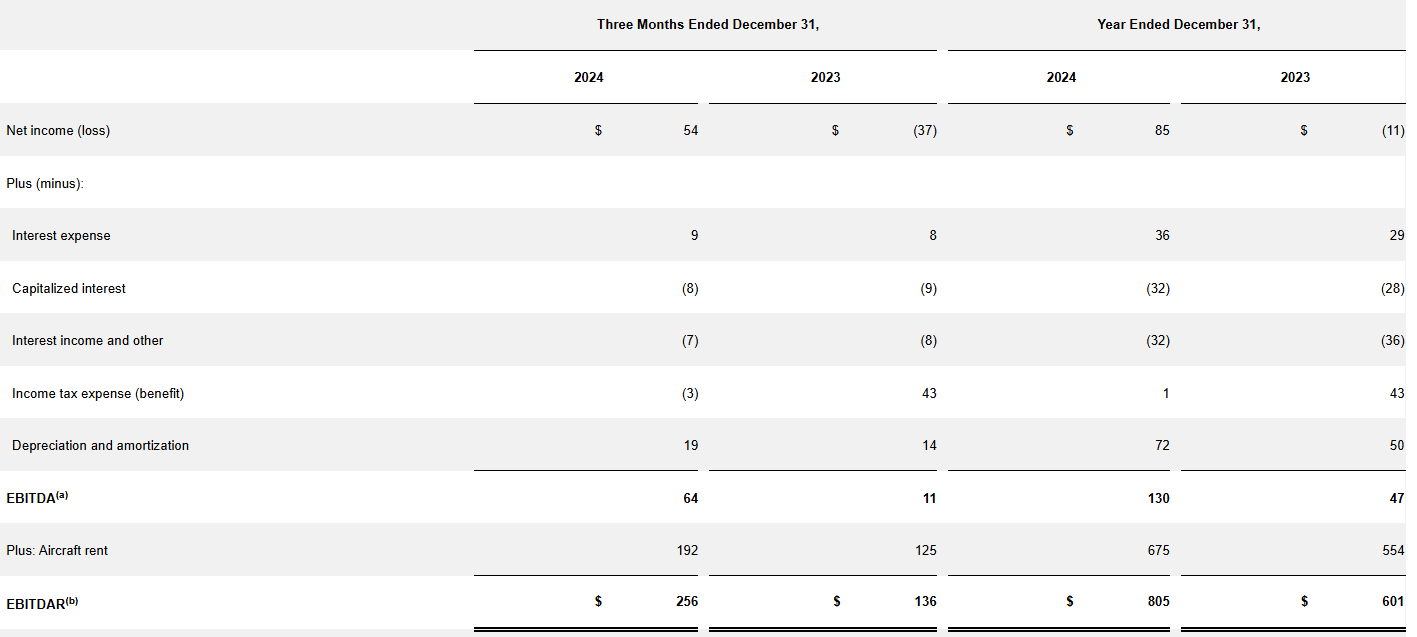
Frontier Airlines 2024 earnings report
In Q1 2025, Frontier reported a negative EBITDA of $26 million, while EBITDAR stood at a positive value of $135 million.
Comparison example
As we said, these metrics are mainly used to compare businesses in terms of operational efficiency. Let’s take Frontier and United as an example. Because their aircraft ownership structures are very different, for a more accurate comparison, we have to pay attention to EBITDAR margins instead of net or EBITDA margins. Here are the 2024 numbers.
United:
- Net margin = 5.5%
- EBITDA margin = 14.4%
- EBITDAR margin = 14.7%
Frontier:
- Net margin = 2.3%
- EBITDA margin = 3.4%
- EBITDAR margin = 21.3%
So we can see that even though United’s overall profitability (net margin) was higher, Frontier showed better operational performance (EBITDAR margin). However, rent payments then ate up a big chunk of income. In other words, Frontier’s cash-generating core business was solid, though accounting profits were slimmer.
Related metrics
Lenders, investors, analysts, and rating agencies closely watch both EBITDA and EBITDAR when evaluating airlines, along with other related metrics.
EBITDAR multiple or Enterprise value to EBITDAR (EV/EBITDAR) shows how much investors are willing to pay for each dollar of operational earnings, adjusted for rent. Enterprise value here represents the total value of a company, including both equity and debt, minus cash. Generally, a high EV/EBITDAR ratio may indicate that the company is overvalued or that investors have high expectations for future growth.
Fixed charge coverage ratio ([EBITDAR+fixed charges]/fixed charges) shows a company's ability to cover its fixed expenses, like interest and lease obligations, with its earnings. Higher values indicate better financial health.
Adjusted debt to EBITDAR measures an airline's debt against its ability to generate operational earnings. This ratio is important for understanding financial risk. The lower value means that the company is successfully paying and refinancing its debt.
In late 2024, IATA reported that despite higher interest rates, airlines reduced their debt levels. The adjusted net debt/EBITDAR ratio fell to 3.3x, down from 3.6x in 2023 and well below the 2017-19 average of 4x.
EBITDAR in hospitality
In hospitality, there are two main business models: asset-light and asset-heavy.
In the asset-light model, the hotel brand doesn’t own or lease most of its properties. Instead, it either manages hotels that belong to someone else (and earns a management fee for running the business) or franchises its brand to other owners (and earns a franchise fee from licensing).
In contrast, the asset-heavy model involves owning or long-term leasing many properties. In this case, a big part of the income comes from the operating profits.
For asset-heavy businesses, rent can become a major expense if many properties are leased. So by excluding rental costs from the calculation, EBITDAR allows us to adjust for different business models when assessing operational efficiency.
And comparing performance between leased properties can also be tricky as rent varies widely depending on the hotel type, size, and location. For example, a boutique hotel in New York City likely pays much higher rent than a similar-sized 3-star guesthouse in Bismarck or Topeka. In this case, to compare operating margins on a more similar footing, it makes sense to track property-level EBITDAR as it strips out the rent expense difference.
That said, the asset-light model has gained extreme popularity – especially after the 2008 crisis and more so, after the pandemic downturn. All major hotel groups have switched to the leaner approach due to its scalability and lower capital requirements. McKinsey estimates that only 2 percent of hotel properties in the US are owned by the top operators.
For example, IHG owns or leases less than 1 percent of its 6,600+ properties, which makes it one of the most asset-light hotel groups. Hilton reported 50 owned/leased properties – out of its 8,447. Hyatt disclosed a list of 31 owned/leased properties, which is about 2.2 percent of its 1,400+ portfolio.
For these and other hotel brands that operate under the asset-light model, EBITDAR and EBITDA figures are nearly identical, as rent expenses are minimal. So to adhere to general standards, these hotels only report EBITDA.
In contrast, Meliá Hotels International is more asset-heavy. Of its 362 properties, it owns 40 (11 percent) and leases 85 (23 percent). So to provide a better picture of its financials, it reports both EBITDA and EBITDAR, reflecting the impact of rental expenses.
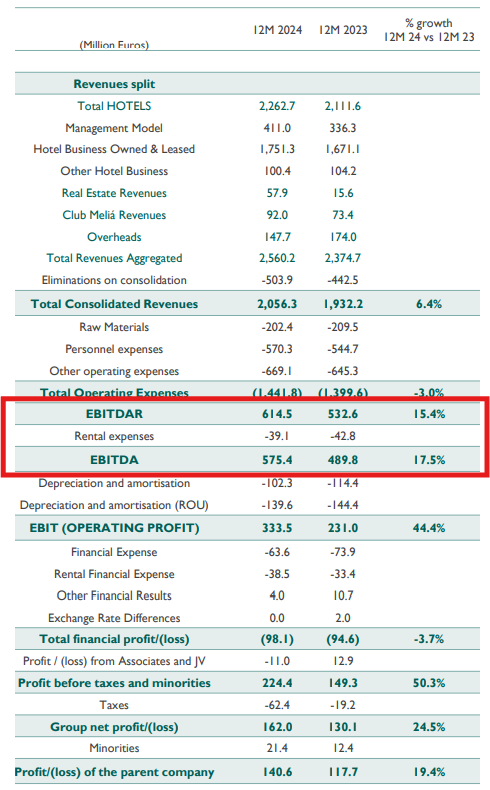
Meliá Hotels 2024 earnings report
In summary, EBITDA is a more commonly used metric in the hospitality industry given the prevalence of the asset-light model. But of course, analysts and investors choose between these metrics based on the company and their specific needs – EBITDA for simplicity and broad profitability analysis, and EBITDAR for granular, apples-to-apples comparisons and credit evaluations.
Of course, margins are important for comparison and benchmarking. According to FullRatio, the average EBITDA margin in the lodging sector is 15.8 percent. So hotels with a higher figure can be considered more successful than the industry average.
To gain deeper insights into financial performance, analysts combine EBITDAR with other key metrics like ADR (average daily rate), occupancy, and RevPAR (revenue per available room). For example, a high RevPAR alongside a low EBITDAR margin could be a sign that the hotel is generating strong revenue but struggling to convert it into profit due to high operational costs.
Read about all the essential hotel KPIs in our detailed overview.
So is EBITDAR a better metric for the travel industry?
EBITDA is a popular metric because it attempts to show a company's operating profitability before the impact of financing decisions, tax strategies, and noncash accounting items (D&A). Essentially, it's often seen as a proxy for cash flow from operations.
However, in industries with substantial lease obligations, such as travel, EBITDA can be somewhat misleading. Companies with different property ownership structures will have different profit profiles. EBITDA might mask these differences, making it harder for investors to compare firms effectively.
So tracking EBITDAR certainly has its benefits.
EBITDAR provides a clearer picture of how efficiently a company runs its core operations without the influence of its capital structure.
EBITDAR enables more accurate comparisons of operational performance, regardless of whether companies own or lease their assets.
Despite its advantages, EBITDAR (as well as EBITDA) has limitations that should be considered.
EBITDAR doesn’t give a complete picture of overall profitability as it ignores interest, taxes, depreciation, amortization, and rent. But these are still crucial costs that strongly affect income. We’ve seen examples of asset-heavy companies (e.g., Frontier) reporting a positive EBITDAR – but a negative bottom line.
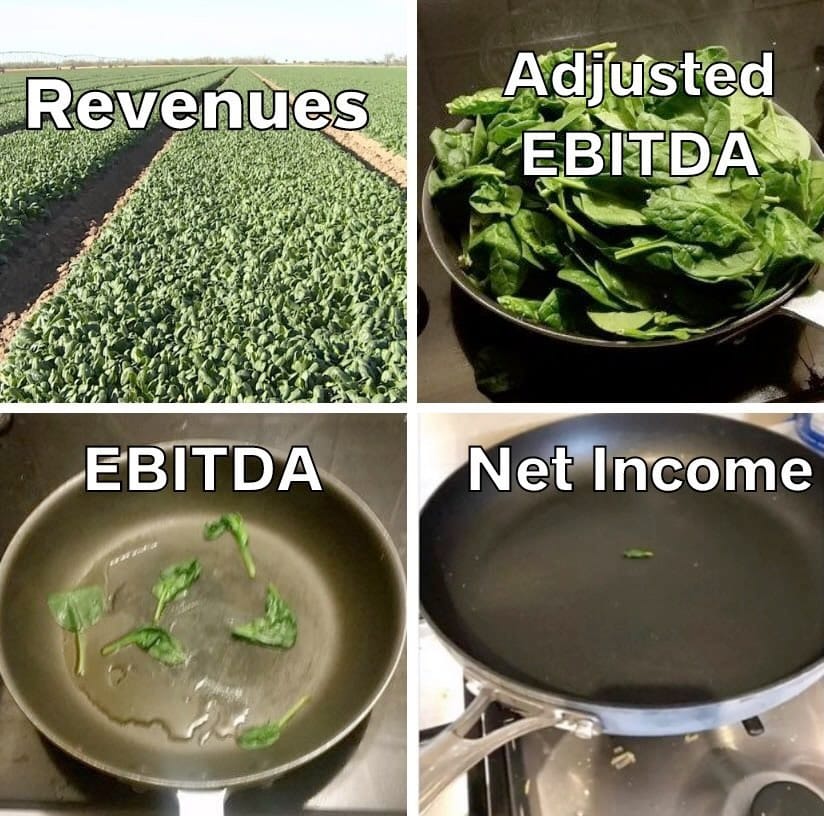
The magic trick of hiding the costs – until reality hits. Source: mike_valueinv on Threads
Warren Buffett, a legendary investor, is known for criticizing EBITDA for similar reasons, saying that it excludes essential expenses like interest and depreciation, potentially giving a false sense of profitability.
Trumpeting EBITDA is a particularly pernicious practice. Doing so implies that depreciation is not truly an expense, given that it is a “non-cash” charge. That’s nonsense.
EBITDAR is not a GAAP metric, so calculations can vary from company to company. This leads to inconsistencies in how it's reported and compared across firms and opens the door for potential manipulation.
So EBITDAR can be useful when comparing businesses with different lease structures or when operating efficiency is the key focus. However, it can paint a “rosier” picture, leading to overestimating the company’s net profitability. This is why it shouldn’t be used in isolation. Complement it with other financial metrics, such as EBITDA, net income, free cash flow, debt ratios, etc. Together, these metrics provide a clearer, more nuanced view of the company’s financial health and profitability.

Maria is a curious researcher, passionate about discovering how technologies change the world. She started her career in logistics but has dedicated the last five years to exploring travel tech, large travel businesses, and product management best practices.
Want to write an article for our blog? Read our requirements and guidelines to become a contributor.

