

Speed is certainly a word that characterizes the flow of things in today's world. Downloading a movie or a song has never been so fast, but you don’t have to. Streaming services like Netflix, Prime, and Spotify bring it right into your device in a split second. So, what has changed?
Streaming services made it possible for us to consume content continuously without uploading the whole file. Such a method requires sending and receiving millions of bits of data at any given moment, so that you can play another Black Mirror episode on the go. Due to its similar behavior to a physical jet of water, continuous transition of data was named streaming, and now it exists in different forms.
Media streaming is one of them, but it’s only the tip of the data-streaming iceberg. With the growth of internet-of-things (IoT) devices, overall data volume increased, and engineering advancements in this field led to new ways of collecting, processing, and analyzing data. As a result, it became possible to provide real-time analytics by processing streamed data.
Please note: Since this topic requires some general understanding of analytics and data engineering, we suggest you read the following articles if you're new to the topic:
A complete guide to business intelligence and analytics
The role of the business intelligence developer
Data visualization as a part of data representation and analytics
Or you may watch our explainer on data engineering:

Learn more about data engineering in 14 minutes
This article explains what streaming analytics are. We’ll take a look at data streaming, real-time processing, and the difference between traditional and streaming analysis with real-life examples of it. It’s essential to also cover the benefits of processing streamed data, and the main use cases for this type of data analysis.
What is streaming or real-time analytics?
Streaming analytics or real-time analytics is a type of data analysis that presents real-time data and allows for performing simple calculations with it. Working with real-time data involves slightly different mechanisms as compared to working with historical data. Namely, it uses a specific type of processing large amounts of constantly updating data, called stream processing.
Data streaming explained
This type of analytics works mainly with data flows, without complex analytical tasks. The main purpose of it is to present the user with up-to-date information and keep the state of data updated. Given those characteristics, stream analytics is typically used in the following industries:
Heavy machinery/transportation/fleet operations: sourcing data streams from sensors and IoT devices;
Healthcare: real-time monitoring of health-conditions, clinical risk-assessment, client-state analysis, and alerts;
Finance: transaction processing, market/currency state monitoring;
Retail/customer service: customer behavior analysis and operations improvement;
Manufacturing/supply chain: real-time monitoring, predictive maintenance, disruption/risk assessment;
Home security: IoT data stream analysis, smart protection, and alert systems improvement; and
IT: any can kind of real-time data analysis like fraud detection or system maintenance.
Nevertheless, the sphere of usage can coincide with traditional analytics. To understand the specifics of stream processing, let’s compare it with traditional batch processing.
Batch processing
When we talk about traditional analytics, we mean business intelligence (BI) methods and technical infrastructure. BI is a practice of supporting data-driven business decision-making. And it mainly focuses on historical data, which in most cases doesn’t lose its importance or relevance.

Batch processing architectural components
Historical data is stored as a stable unit that can be divided into pieces. In the process of ETL and warehousing, the data is moved and processed by batches. A batch has to be queried by a user or a software program. So, the system would understand when to fetch data and which pieces of it, how to process it, and present it to the end user.
Example: an organization stores sales data in its warehouse. Once the user wants to query data for analysis, he or she will pass parameters to define the required portion of the information, for instance:
Product: leather strap
Sales region: Northern California
Time-period: 1st quarter of 2019
The system would understand which data to fetch from storage. So, each piece of data passing the given parameters would be a batch.
Stream processing
Streaming came up as a relatively new concept. At first, streaming processing deals with data streams. A data stream is a constant flow of data, which updates with high frequency and loses its relevance in a short period of time. For example, these could be transactional data, information from IoT devices, hardware sensors, etc.

Stream processing architectural components
As data streams have no beginning or end, they can’t be broken into batches. So there is no time when the data can be uploaded into storage and processed. Instead, data streams are processed on the fly.
Example: A security organization installs motion sensors and alarm systems at clients houses. Motion sensors collect information about the movement every second and sent security alerts signal surpasses some threshold. The data coming to the processor would then be divided by each sensor, and by certain groups of sensors. So, to view the data, a user will have to ingest a data stream coming from, say, a back-entrance sensors group. As the data stream is ingested, the user will be able to view real-time numbers and changes of a given group of sensors.
So the application logic in this case turns into a vicious circle, because queries and processing are done continuously. Nevertheless, data streams can also be a source of information to collect historical data. In this case, an additional warehouse would store this data to be formatted and further used in BI.

Stream and batch processing combined into one analytical platform
Now, to carry concurrent processing of multiple streams, we need specific hardware and software. Stream processing is held by systems called event stream processors (ESP) that are able to ingest data streams and process them with a small response time and no data loss.
Events (the data) can be generated by many sources at the same time, perhaps from beacons at a large mall. Beacons track customer movement along the mall, constantly sending location data. That would be a data stream.

Beacons gather customer-location data to pass it as a data stream
Source: www.todaysoftmag.com
ESP processes all of this data simultaneously by fetching location, keeping it updated, and constantly bringing it to the user. Further, the data can be viewed as a real-time tracker through an analytical dashboard that will update customer location either by request or constantly.
Stream processing tools
Dedicated technologies that make stream processors capable of fast computation and concurrent work with multiple data streams is the key to building a streaming analytics platform. Let’s look at the major technologies.
Apache tools: Kafka, Spark, Storm, and Flink
Originally developed by LinkedIn as a messaging queue application, Apache Kafka was open-sourced and donated to Apache in 2011. After that, Kafka evolved into an open-source, data-streaming platform.
Kafka is a stream processor, which integrates applications and data streams via an API. In line with other products by Apache Foundation Software, Kafka has been popularized by giants like Uber and Netflix. Because of its ability to run concurrent processing and move large amounts of data quickly, Kafka is used for big data streams, like Netflix’s big data ingestion platform.
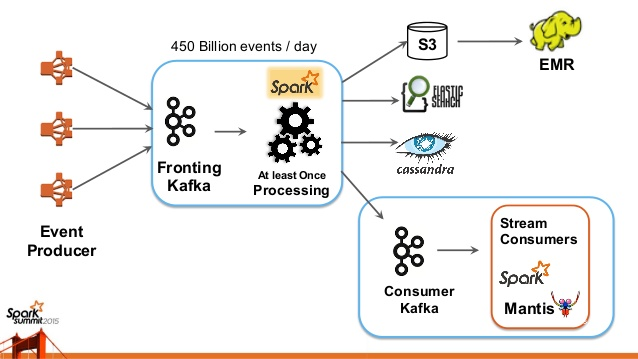
Netflix's big data ingestion platform architecture
Source: slideshare.net/SparkSummit
Apache Kafka can be also integrated with Apache Hive, a warehousing solution, and Hadoop for batch processing of the stored data. Or it can be used with Apache Spark, a big data processing engine. But, there are a bunch of other instruments to work with stream processing such as Storm and Flink for distributed stream processing, and mixed types of data processing. Both can also be used as an ETL tool or a batch processor integrated into Hadoop.
Amazon tools: Kinesis Streams, Kinesis, and Firehose
Amazon Kinesis Streams is a scalable and customizable solution for processing and analyzing data streams. Kinesis Streams provides a stream processor and also allows you to build your own applications by using client libraries, connectors, and APIs.
Amazon Kinesis. You can also use managed stream processing solution Amazon Kinesis. Except for managed processing and fine-tuning, Amazon Kinesis offers a wide list of possible integrations with Apache services like Spark and Kafka mentioned earlier.
Amazon Firehose enables you to integrate data streams into existing BI tools and analytical interfaces or a warehouse. It can also help you to fetch data and integrate it into existing warehousing solutions by Amazon such as S3 and Redshift cloud warehouse.
The architectural solution you choose would vary in the number of instances you run your data through. However, all of these are available in the market for specific streaming needs. Now let’s address the user-facing part that can serve as a real-time analytics interface.
Real-time analytical instruments
Integrating data streams into your data platform is a major step in creating your own real-time analytical solution. On this stage, you’ll be able to receive the data and perform calculations for analysis. However, it does nothing without UI, where users can view the information, create visualizations, and operate within the dashboards.
If you are a business intelligence practitioner and you already have an analytical tool, you can integrate the data stream right into it. BI interfaces are used for various analytical purposes, including working with big data and data mining. So, providing real-time analysis is another option you may use the interface for. Check out our dedicated material about the available BI tools.
Now, we’ll focus on complex solutions offering stream processing, data ingestion, and analytical software.
Azure Stream Analytics
Azure Stream Analytics is a stream processing platform by Microsoft paired with its analytical interface Power BI. Both solutions are fully managed and deployed in the cloud. Stream Analytics uses Trill stream processor by Microsoft. It integrates data and provides low-latency processing across multiple sources.
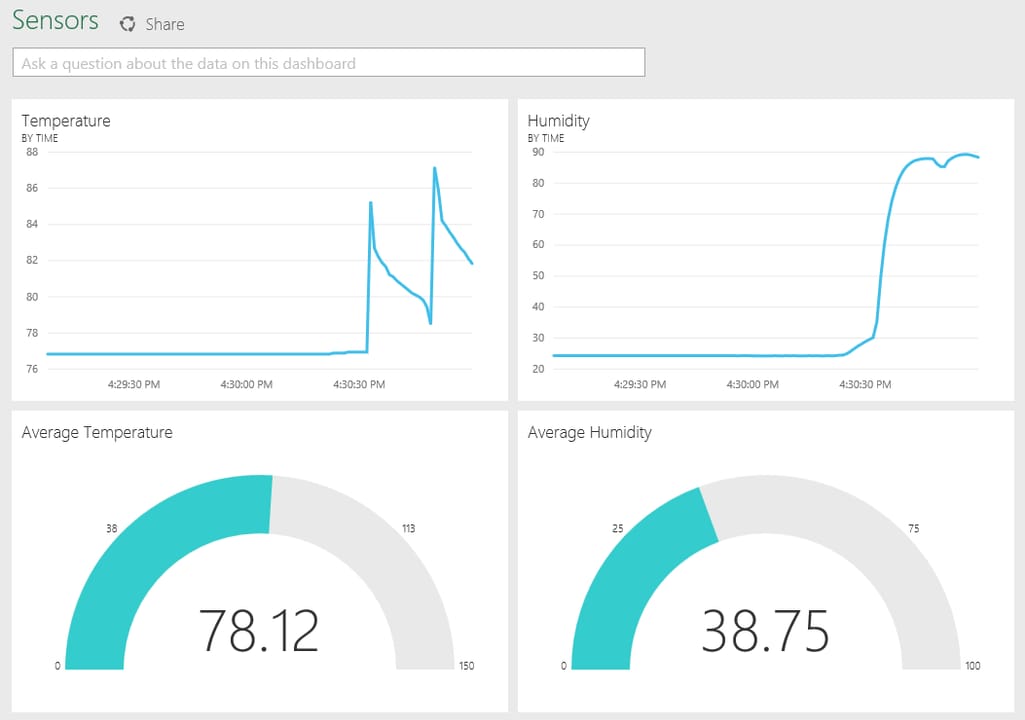
Real-time data coming from hardware sensors measuring temperature in PowerBI
Source: powerbi.microsoft.com
Power BI is a general-purpose, business intelligence tool that can be used both for batch and real-time analytics. Microsoft documentation contains a guide to integrate Stream Analytics into Power BI. What it does allow you to do is connect data streams to Power BI and manage data by updating dashboards and creating visuals via interactive elements and settings.
GoogleCloud Stream Analytics
Google Cloud Stream Analytics offers similar capabilities in terms of stream processing, as their product includes a dedicated engine for data ingestion, processing, and analysis. The operations with data can be handled by three instruments:
- Pub/Sub is a messaging service and data ingestion tool, similar to Apache Kafka. It allows you to perform event updates and data transition into a staging storage.
- Dataflow is a tool for managing ingested data. Basically it’s a data transformation/formatting tool designed both for batch and stream processing.
- BigQuery is a cloud warehousing solution by Google, which can be used as storage for your data platform.
As an analytical interface, the data pipeline can be plugged into Google Cloud BI. It can be used along with Google Data Studio as a data platform UI. As long as Dataflow is built using Apache Beam SDK (a unified programming model for data processing), Google offers integration of machine learning models into your stream analytics, using TensorFlow and Beam.
Oracle Stream Analytics
Oracle Stream Analytics is a cloud-based platform that offers an all-in-one solution for stream ingestion, processing, and visualization. The platform is built on top of Apache Spark, so it’s compatible with other Apache technologies. The data ingestion is done via Apache Kafka. But, data transformations, log captures, and real-time data integration can be done via dedicated package Oracle GoldenGate.
Other important considerations are visualizations and data representation. You can find a dedicated BI tool by Oracle, but it doesn’t provide much information about integration with the Stream Analytics platform. The reason for that might be in a dedicated interface to work with tabular real-time data and visualization of IoT streamed data.
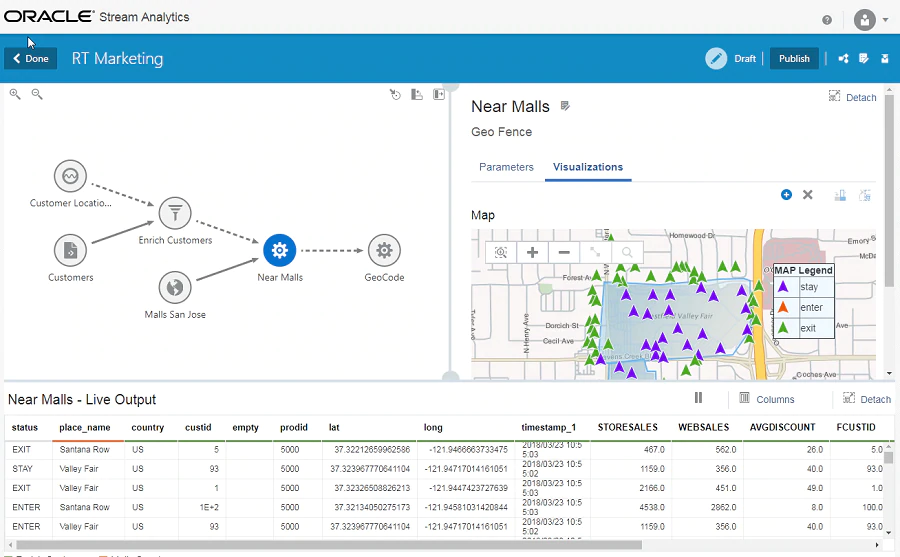
Oracle Stream Analytics IoT geo-visualization in a real-time data dashboard
Source: www.oracle.com
Oracle also supports AI-driven solutions based on machine learning algorithms, so you might consider this if you’re into ML.
IBM Streaming Analytics
IBM Streaming Analytics is available for building real-time analytical applications. It’s powered by IBM Streams, a data platform for stream processing, data ingestion/transformation, and analysis. Streams can be deployed either on cloud as a part of IBM Cloud or on premise. As all the mentioned platforms above, IBM also supports Kafka as a messaging and data ingestion instrument.
What are the real-world examples of streaming analytics?
Okay, we’ve discussed the theoretical part of how stream processing works in general and how it’s applied to data analysis and business use. Now it’s vital to mention some real-world examples of how enterprises utilize real-time analytics and the benefits it delivers.
Uber: Chaperone auditing tool
We all know what Uber does: an international ride-hailing and food-delivery service. Uber mobile applications deal with two real-time instances:
- Tracking location of drivers and clients requires constant data flow and updates of geolocation, pushing this data to both types of application users. This means that Uber has to deal with petabytes of messages to keep track of data flow.
- Constant financial flow coming from Uber users that make payments directly through the application requires monitoring. Financial operations mean there is a high risk of fraud. So, in addition to the amount of controlling streamed data, Uber also has to be on the alert with fraud detection.
Uber’s Chaperone auditing data platform, based on Apache Kafka, was built to respond to these two issues. Using Kafka as its messaging service, Uber performs high-speed data loss, auditing, and duplicate detection. Performing audits between multiple data centers, it became possible for Uber to both decrease error rates, avoid data loss, and improve fraud detection.
Netflix: Keystone Streaming Platform and Mantis
Keystone Stream Processing Platform. Netflix deals with petabytes of real-time data to process, so Keystone is not the only data platform working with data stream. In the heart of it is Apache Kafka as a messaging service, allowing low-latency processing, while Flink holds distributed streams. Further, the platform connects to the analytical interfaces with separate Kafka on the user-facing part. Additionally, the data is sent for batch processing using S3 by Amazon and ElasticSearch.
Mantis. Another stream processing platform by Netflix is Mantis, which mainly focuses on building a low-latency, real-time application on top of it. Mantis focuses on operational applications for internal organizational usage, so it has a completely different set of tools inside. Without diving into too many tech details, Mantis provides operational dashboards and real-time alerts to work with data.
How to start stream analytics
By any means, acquaintance with Apache products and frameworks would make it a lot easier to implement your own platform. Our recommendation in building a dedicated platform is to keep the focus on choosing a diverse stream processor to pair with your existing analytical interface. Or, keep an eye on vendors who offer both stream processing and BI as a service.
The best way to start with stream analytics is to look at what Apache offers in terms of open-source instruments. Mainly you can focus on Kafka documentation, as most data platforms and products for streaming analytics are based on it both as a messaging service and stream processor.