

From the perspective of business analysts (BAs) — at least those with a sense of humor — “being a BA is as easy as riding a bike. Only the bike’s on fire, you’re on fire, and the ride’s in hell.”
Tough as it is, the life of business analysts would be even harder if it were not for smart digital solutions helping them resolve daily tasks. In this article, we credit the software used in business analysis. To spot the most effective solutions along with their pros and cons, we scrupulously inspected toolboxes of business analytics both from AltexSoft and other IT companies. Our findings are laid out below.
Major functions of business analysts and categories of business analysis software
The functions of BAs may differ slightly from company to company or project to project. But mainly their area of responsibility encompasses:
- eliciting business requirements and goals;
- analyzing requirements and recommending solutions based on factual data;
- defining the project scope and breaking down the initial goal into actionable steps;
- translating requirements into details, comprehensible for developers;
- delivering quality visualizations on topics like business processes, system designs, and project status to effectively communicate with stakeholders; and
- creating different types of technical documentation in the course of product development.
For now, there is no end-to-end system to perform all BA tasks in one place. To cover their needs, business analysts use several types of software that fall into three large categories:
- requirements management tools,
- visualizing tools, and
- additional tools for collaboration and performing daily office tasks.
The third category includes messengers like Skype and Slack, apps for taking notes and to-do list apps. There is nothing BA-specific about them, so we’ll omit the third group to focus on the first two categories instead.
Requirements management tools for business analyst
Basically, requirements management (RM) tools are any software that helps you specify project requirements, so that they will be unambiguous, realistic and agreed-upon. From this perspective, we cannot help but mention Word and Google Docs widely used by business analysts to lay down requirements and collaborate on them with stakeholders.
Something is wrong with a genie’s user story. Source: ModernAnalyst.com
Another essential tool in a BA kit is Excel. For a couple of decades, experts of all kinds have been predicting the death of cumbersome spreadsheets. However, they are still here, unrivaled and loved by professionals from different domains. Say, business analysts appreciate Excel (or its alternative, Google Sheets) for a wide range of formulas and functions, irreplaceable for requirements analysis, decomposition, and evaluation.
“While Excel can be useful for basic analysis, it is powerful enough to take on very advanced analysis as well,” Evan Ankney, business analyst and the owner of Sportsbook Scout argues, based on his vast experience with many different types of BA software.
However, Google Docs and Excel are often not powerful enough to meet all the challenges of requirements management. When it comes to large and complex projects, more specific RM software should be utilized in addition to or instead of traditional documents and spreadsheets mentioned above. We selected the five most popular systems to compare their functionality.
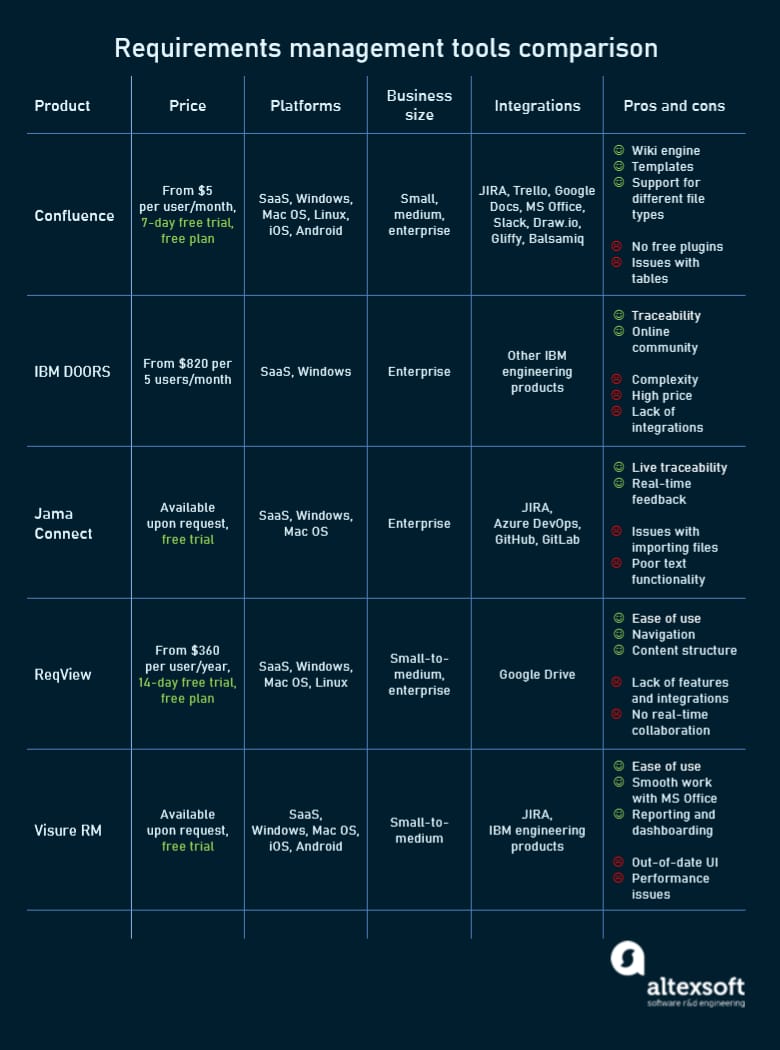
Review of requirements management software.
Confluence: creating rich content around products of any size
Pricing: from $5 per user/month, with a free version and 7-day free trial available.
Confluence is a cloud-based collaborative platform on top of a wiki engine that allows for collecting data in a centralized place and continuously working on it together. All product-related documents are created as wiki pages within a shared knowledge base.
You can write texts inside a page, insert images, screenshots, and videos, upload MS Office files (Word, Excel, PDF, or PowerPoint), and drop links to other internal or external content.
To make things easier, Confluence offers a range of pre-formatted templates for documenting product requirements, taking meeting notes or recording important decisions. Everyone who has access to the knowledge base can edit a document or leave comments.

Product requirements template in Confluence.
As a part of the Atlassian suite, the platform seamlessly integrates with other family members, including popular project management tools Jira and Trello. Iryna Ananko, BA at AltexSoft, states that “Confluence plus Jira combo gives you virtually everything you need to do business analysis.” You can view Jira issues or create new ones right on the Confluence page.
A rich set of plugins connects Confluence with numerous other tools used by BAs — like Google Drive or diagraming software Draw.io and Gliffy. But all these add-ons are available on a paid basis.
Limitations. While you can create tables in Confluence, their functionality is not as extensive as in Excel. Integration with Excel is also far from perfect.
IBM Engineering Requirements Management DOORS Next: old-fashioned but reputable software for enterprises
Pricing: from $820 per 5 users/month, with a free trial available.
The longstanding industry leader for RM, IBM DOORS lets you take control over product documents secured in one central location. You can easily create document baselines, track versioning as requirements become more detailed, and link change requests directly to initial documents.
The system supports collaboration through concurrent access to requirements databases. It also offers customizable dashboards for data visualizing and automated reporting. The software has cloud-based and on-premise versions.
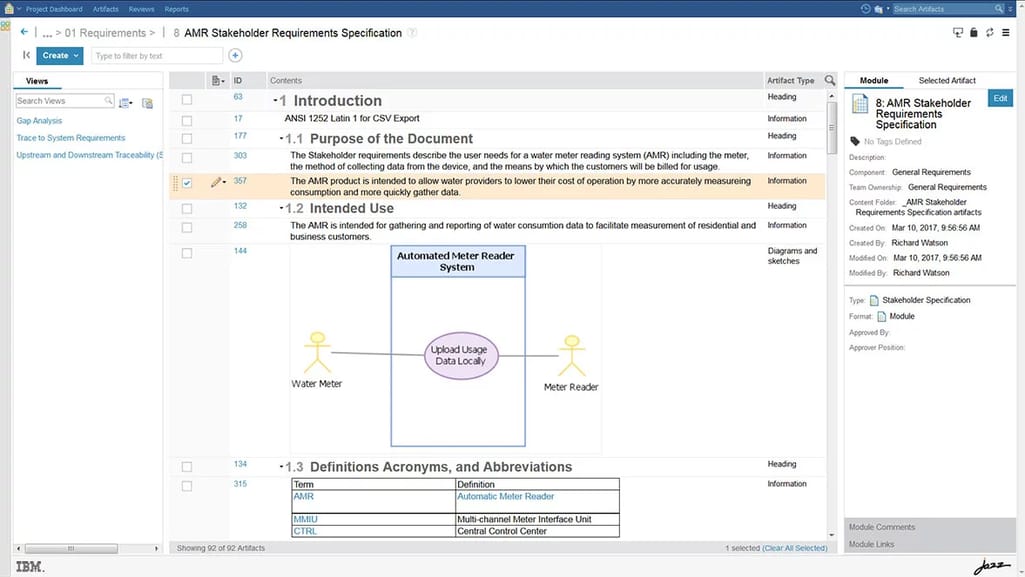
Requirements specification in IBM DOORS.
Limitations. The interface is old-fashioned and non-intuitive. Users find it hard to import images, pdf and text files. Overall, the software doesn’t offer integrations outside the IBM technology ecosystem, limiting the ability to adopt other tools. The learning curve is steep and the cost of owning is too high for small companies.
Jama Connect: agile management of requirements for complex projects with multiple subsystems
Pricing: available upon request.
Jama Connect is a modern alternative to IBM DOORS with an intuitive interface, live traceability across requirements, and an effective notification system. Unlike the IBM product, it easily integrates with other popular systems and tools like Jira and Azure DevOps.
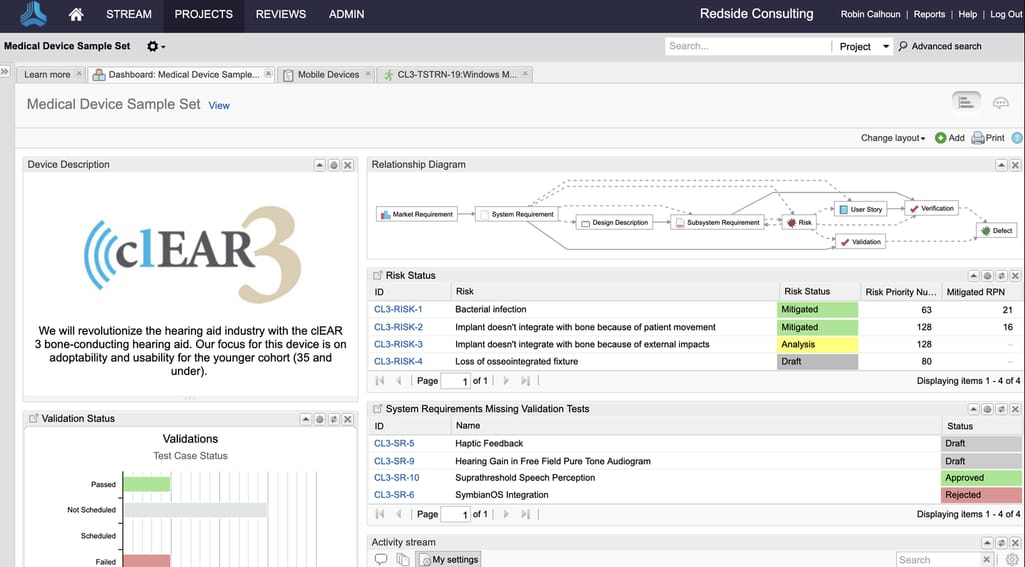
A dashboard with widgets, requirements and specifications for a medical device in Jama Connect.
Deployed on the cloud or on-premise, the software enables you to keep track of the entire product development cycle, from concept to release. It supports different development methodologies, including Agile models, and encourages real-time collaboration with stakeholders and team members. The approval process is simplified by the Review Center feature that allows for gathering feedback and capturing electronic signatures.
Limitations. The system lacks visualizations showing how the product matures and changes over time. A good place for storing and reviewing requirements, Jama Connect is far from perfect when it comes to creating documents. Often, users prefer to use Word, Excel or Google Docs for the first phases of requirements development.
ReqView: easy-to-navigate RM system for small to midsize companies
Pricing: $360 per user/year with a free plan and 14-day free trial for a pro version available.
With ReqView, you can easily organize requirements in structured documents, track and link them to each other. The built-in editor allows you to develop rich texts, add URL links and tables, attach images, PDFs, and other files. Another useful feature is the ability to compare different versions of the same document side by side.
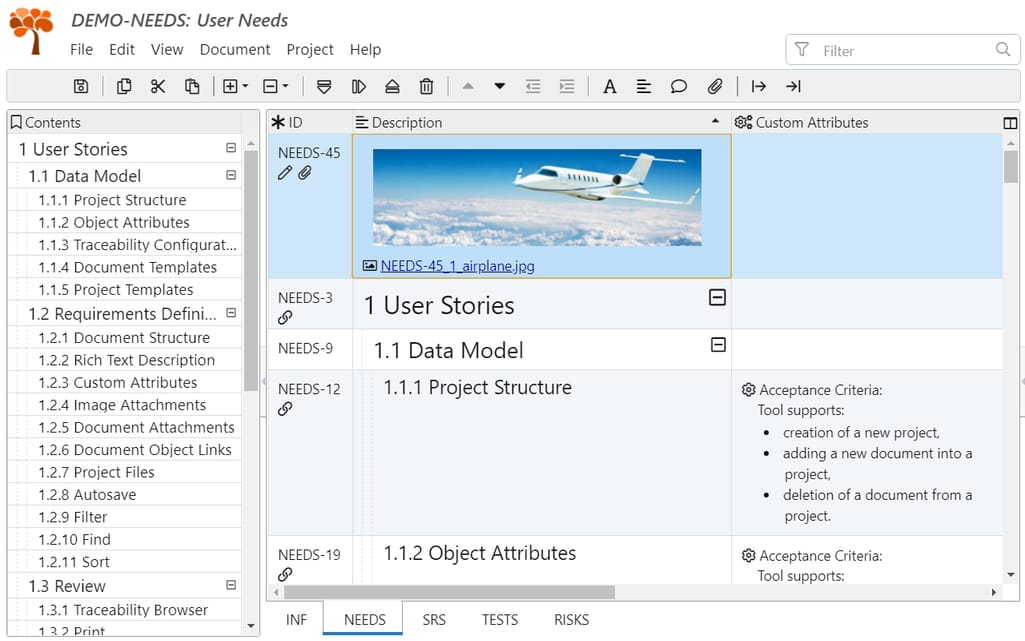
A tabular view displaying requirements organizing in a tree hierarchy in ReqView.
The system integrates with Google Drive for sharing documents with your team. It also supports import from MS Word and Excel along with export to CSV and HTML files.
Limitations. ReqView can hardly compete with more expensive alternatives in terms of functionality. Many useful features and integrations (for example, with Jira) are being planned, but are not available yet. For the moment, collaboration is not implemented, so users can’t work on the same document simultaneously.
Visure Requirements Management: flexible platform meeting any needs
Pricing: available upon request, with a free trial.
Visure Requirements Management acts as a centralized collaborative platform to gather, organize, analyze, validate, and specify requirements. The end-to-end traceability is enhanced with graphical representations. Besides, the tool generates approval-ready content and captures e-signatures to speed up decision-making.
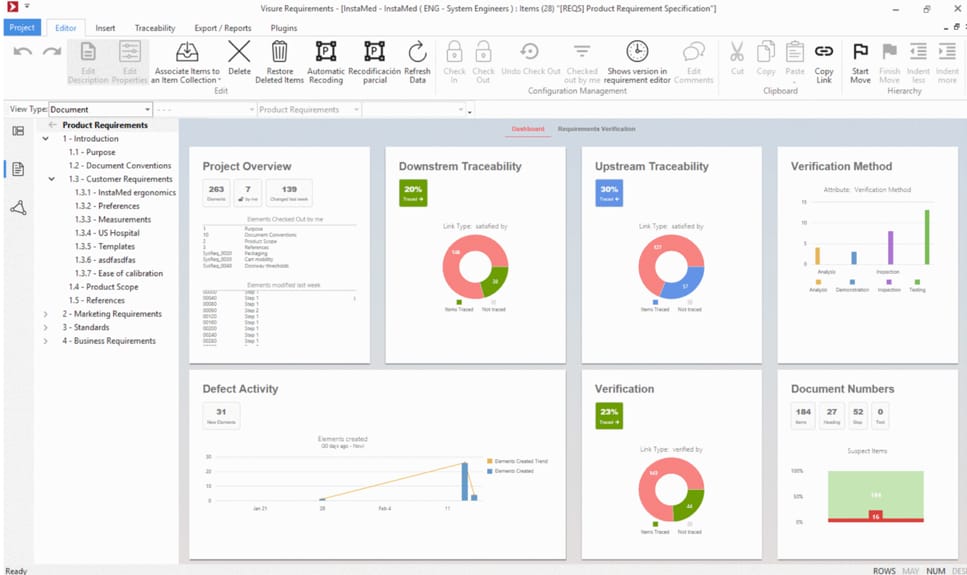
A dashboard for requirements tracing in Visure Requirements.
The system fits almost any organization due to its flexibility and ability to customize features to meet your specific needs. It integrates with Jira and MS Office allowing for seamless import and export to and from Word or Excel. To ensure the quality of documents, Visure Requirements applies natural language processing for spotting ambiguity and weak terms.
Limitations. Sometimes users criticize the tool for an out-of-date interface and poor performance when managing over 50,000 items.
Business analyst tools for visual modeling
It may seem that most of the time business analysts draw charts, build diagrams and make presentations. The truth is that by visualizing data BAs accomplish an extremely important task — they help stakeholders grasp complex concepts and multi-step processes. They employ numerous techniques to illustrate approaches, processes, and relationships at different steps of the product development.
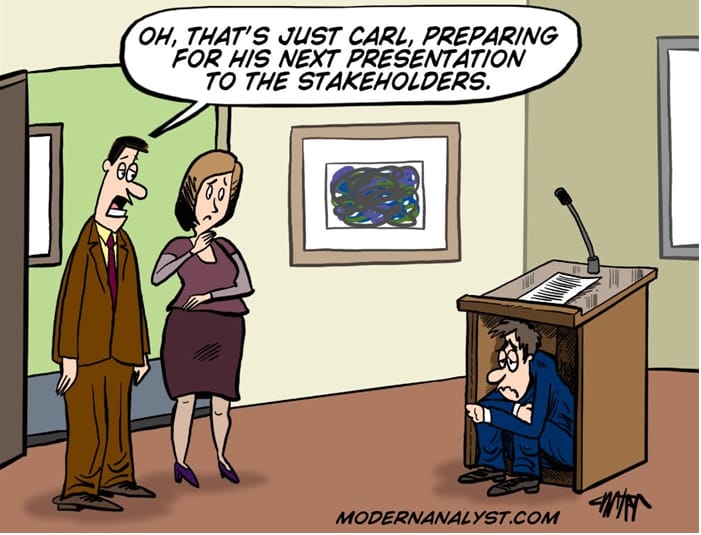
Visuals are sometimes more compelling than words. Source: ModernAnalyst.com
Depending on the project, a BA can employ the following visuals.
Mind maps are hierarchical diagrams showcasing connections and relationships between various pieces of information or parts of the dominant concept. BAs use this technique to capture and organize ideas and concerns at the initial brainstorming phase. Further on, the technique can be helpful for defining requirements, planning, task prioritizing and setting up use cases or sequences of interactions between users and a software solution.
What makes digital mind maps special is their collaborative nature. They allow all participants to make notes, work through problems, and literally stay on the same page.
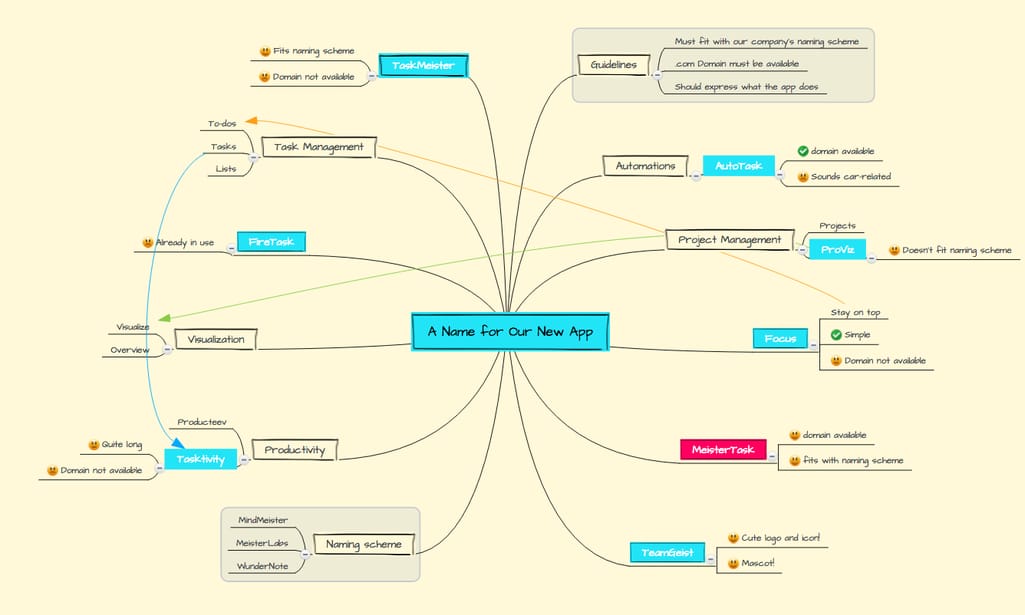
A mind map for brainstorming an app idea. Source: MindMeister
Wireframes are rough sketches that communicate the most essential elements and features of the user interface. This approach allows BAs to create many alternative designs while discussing priorities and basic requirements for functionality with stakeholders. On reaching an agreement, high fidelity mockups are created by UI/UX designers for presentations and development team guidance.
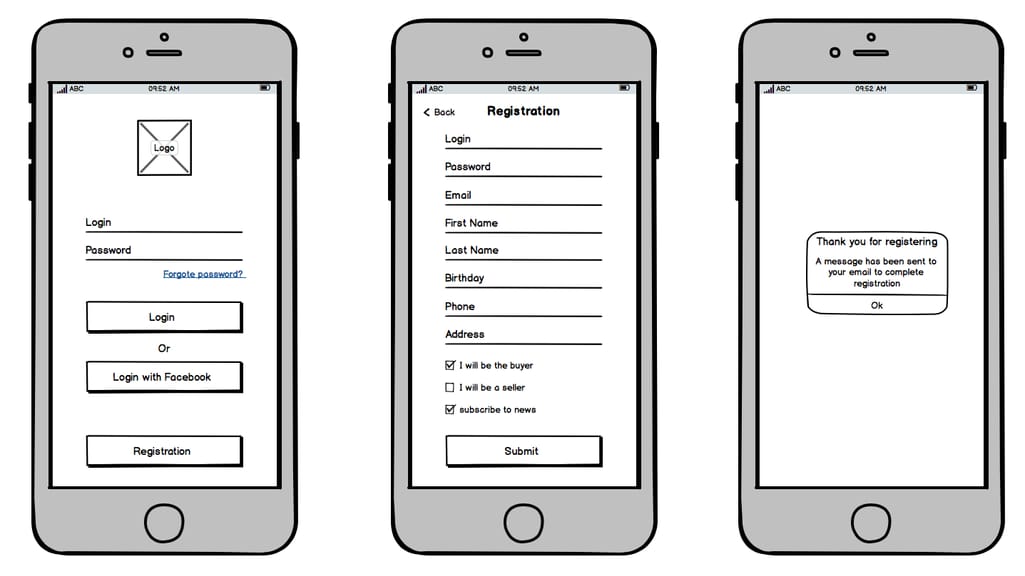
Examples of low fidelity wireframes for a mobile app. Source: Depalma
Product roadmaps communicate a project vision and strategies to both development teams and stakeholders. These high-level visuals allow everybody to focus on product goals and thus add value to users. BAs create roadmaps to showcase different phases of a product’s evolution including:
- Minimum Viable Product (MVP),
- feature releases,
- bug fixes, and
- maintenance.
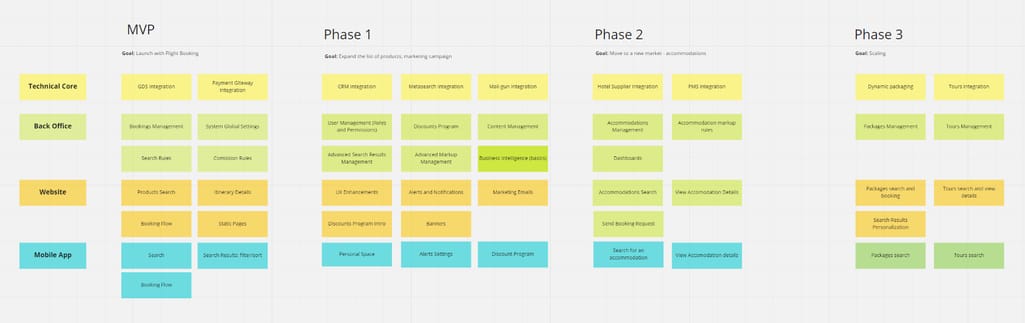
An example of a product roadmap in Miro. Source: AltexSoft BA team.
Flowcharts, also known as workflow diagrams, represent a sequence of events in a process or a step-by-step approach to solving a task. Diagrams apply conventional symbols (shapes, arrows, and so on) to document various aspects such as when the workflow starts and ends, what data is used, who makes decisions and when they are made.
BAs use flowcharts to:
- model steps of business processes from end to end,
- explain what needs to happen in a software system, and
- highlight interactions between team units, spotting bottlenecks and inefficiencies within a process.
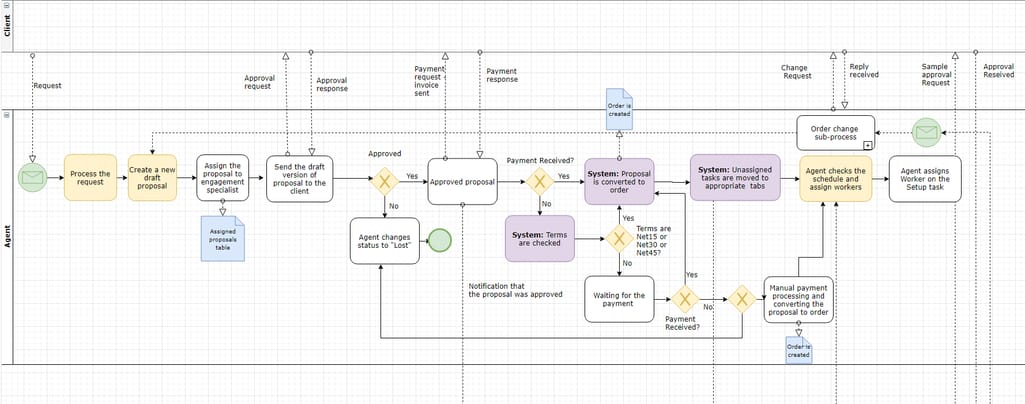
A flowchart describing the business logic of a shop management solution in Gliffy. Source: AltexSoft BA team.
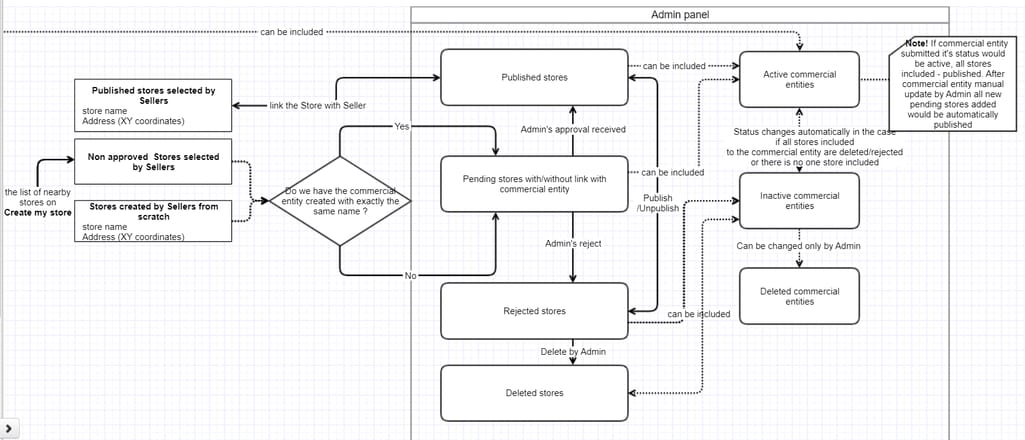
A flowchart describing a business logic of an eСommerce admin panel in Draw.io. Source: AltexSoft BA team.
Entity relationship (ER) diagrams visualize relationships between different entities (concepts, departments, objects, groups of people, etc.) in a system. This technique is applied to organize various data units and define attributes of data elements.
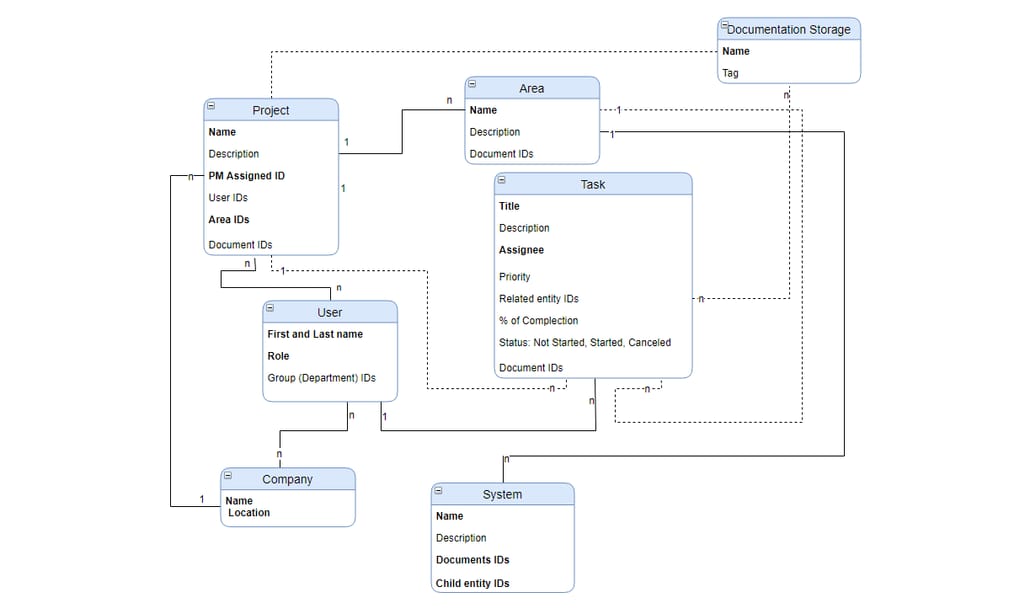
An example of an ER diagram in Draw.io. Source: AltexSoft BA team.
UML diagrams are a popular business modeling technique based on Unified Modeling Language, the standard graphical notation for documenting business requirements. There are 14 types of UML diagrams falling into two groups:
- structure diagrams, showing objects in the system; and
- behavioral diagrams, depicting how objects are interacting with each other.
Business analytics mostly apply UML diagrams of the second type, namely:
- use case diagrams to depict who uses the system and what they do with it,
- activity diagrams to explain the flow of work and information between users and systems, and
- sequence diagrams to show the order of interactions between the user and the system.
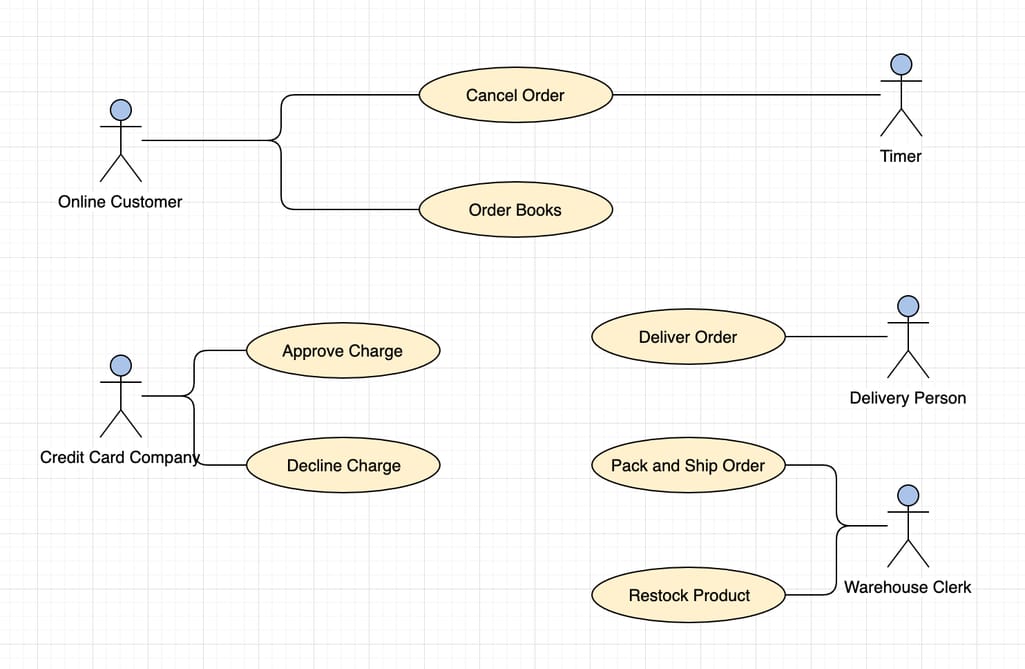
An example of a use case diagram for an order system. Source: Freedgo.com
Since we've outlined the major types of graphical methods, it’s about time we discuss effective visualization tools. To do that, we polled BA experts to create a short list of the most popular solutions, fitting in business analysis tasks.
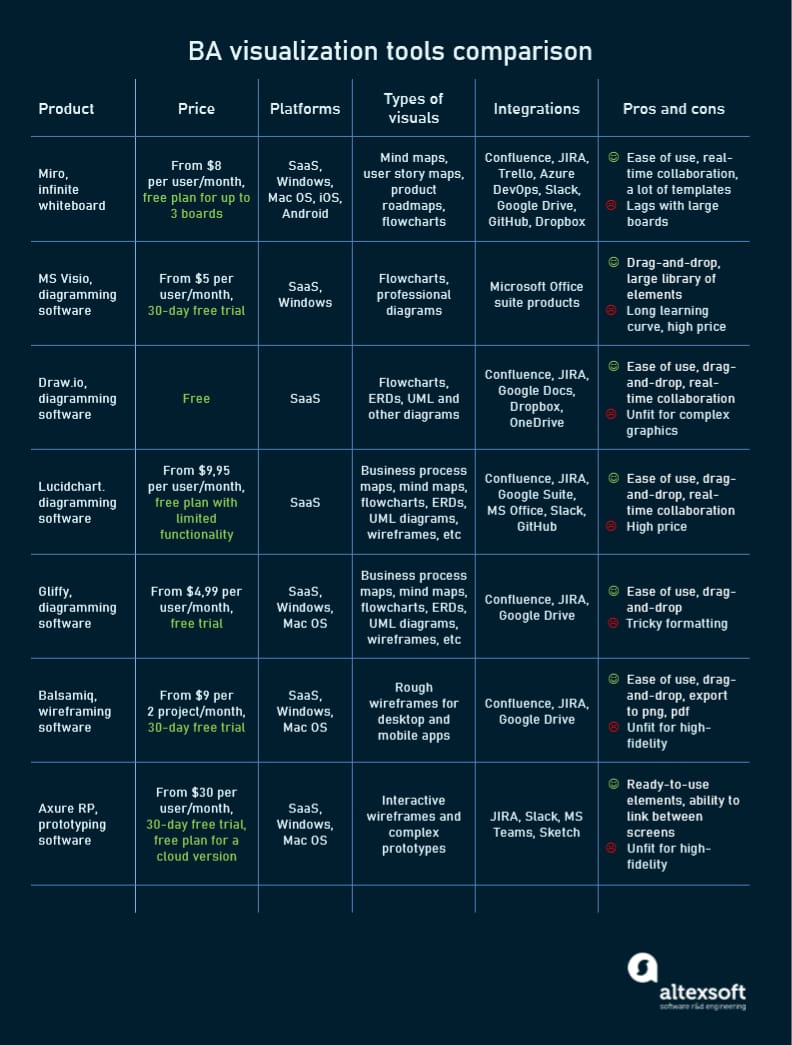
Review of visualization software used by BAs.
Miro: collaborating on concepts and roadmaps
Pricing: from $8 per user/month. Three infinite whiteboards with limited functionality are available for free.
Miro is the most complete digital whiteboard for brainstorming and visualizing ideas. The platform is popular with cross-functional teams, as it allows for effective real-time collaboration with stakeholders and team members, capturing basic requirements, building product road maps, sketching out plans and task flows. and collecting feedback.
The solution is highly praised for its massive functionality, numerous customizable templates, and integrations with other tools and systems widely used in business analysis — including Jira, Confluence, Trello, Microsoft Excel, Google Suite, Evernote, and more. After creating a board with visual presentations, you can share a link with stakeholders enabling them to add comments.
Limitations. The platform can be somewhat slow when dealing with huge, complex boards. Also, it doesn’t support a full-screen mode and isn’t meant for wireframing or building complex flowcharts.
MS Visio: drawing complex multi-level flowcharts and diagrams
Pricing: from $5 per user/month
This representative of the Microsoft family enables you to create elaborate diagrams, visually describing algorithms and relationships in exquisite detail. It is easy to use and has a rich library of preloaded templates. Visio integrates with other Microsoft products such as Word, Excel, and OneDrive.
Limitations. To make complex diagrams, buy the professional version with extensions. It is, however, relatively expensive. It’s worth noting that Visio isn’t included in Office 365 or other MS packages. With cheaper alternatives available at the market, this tool is gradually losing popularity.
Draw.io: building basic schematics fast and easy
Pricing: free. The only paid version is meant for Confluence Server.
Draw.io is a free online diagramming solution designed specifically for drawing schematics. It is not overloaded with extra features, letting you create charts and other visuals faster and easier than with other vector software.
The tool boasts a sufficient collection of shapes and it covers the essential needs of BAs for visualizing processes and connections. Additionally, Draw.io works with numerous formats (PDF, PNG, JPG, etc.), apps and cloud storage services (Trello, GitHub, OneDrive, Dropbox). It supports real-time collaboration when used with Google Drive (all participants must log in via Google accounts).
Limitations. Draw.io doesn’t offer advanced functionality for complex graphics. If you must make resulting diagrams more appealing for presentations there is just no way to do it.
Lucidchart: collaborative diagramming and wireframing
Pricing: from $9.95 per user/month, with a free version available.
Lucidchart is marketed as a cheaper and easier-to-use alternative to MS Visio, supporting real-time collaboration. The platform offers templates and tools for nearly all visualizing practices used by BAs — entity relations and UML diagrams, mind maps, flowcharts, wireframes, etc.
The software is integrated with Microsoft products including MS Visio, so you can quickly import Visio files to Lucidchart. It also works with Google Suite, Confluence, Jira, and Slack.
Limitations. Lucidchart has no offline version due to its collaborative nature. With complex diagrams, the website can lag.
Gliffy: creating and sharing any types of diagrams for non-technicians
Pricing: from $4.99 per user/month. It doesn’t offer a free trial or free version.
Gliffy is intuitive diagramming software popular with business analysts. It supports all UML and ER diagrams, flowcharts, mind maps, wireframes, and other visualization techniques, with a lot of templates to choose from. Similar to Lucidchart, it seamlessly integrates with Gira, Confluence, and Google Drive.
Limitations. The thing users dislike about Gliffy is the inability to create and add custom forms or change colors of the elements to give charts more “personality.” While you can easily share diagrams, there is no way to work on them together. Also, the tool doesn’t allow you to make professional-looking presentations.
Balsamiq: quick wireframing
Pricing: from $9 per month for two projects. A free 30-day trial is available.
The tool enables non-designers to create rough mockups for initial discussion and gathering requirements. Wireframes made in Balsamiq are shareable and look almost like paper sketches which enable stakeholders to focus on important things instead of being distracted by minor details. As a result, you can get quick feedback, make improvements in no time and jump to the next iteration. Balsamiq wireframes are easy to convert to PNG and PDF formats.
Limitations. The software doesn’t allow for adding external graphs or charts so you can’t create data-rich presentations.
Axure RP: interactive wireframing
Pricing: from $29 per user/month for a desktop version . A free 30-day trial and free cloud version are available.
The Axure RP desktop application provides a large feature set for creating polished interactive wireframes that mimic a website. It also allows BAs to build flowcharts and ER diagrams. You can leave notes on the pages to specify requirements and gather feedback directly on-screen. The tool also allows for using Slack and Microsoft Teams notifications.
Limitations. The application has a limited set of screens for mobile app wireframing. Also, it’s less intuitive than many other alternatives, so the learning curve can be somewhat difficult.
For BAs, note-taking is almost a skill by itself. Source: ModernAnalyst.com
With so many tools available, the choice is most often dictated by your budget, project size, and stakeholder preferences. Here are some popular combinations.
Google Docs + Excel. When dealing with small and simple projects, “Sometimes, all you need is Google Docs for capturing requirements and discussing them with stakeholders plus Excel for organizing data in tables,” Tatiana Sverhunenko, a research manager from AltexSoft says. Note-taking apps like Evernote will be helpful to capture comments and suggestions of stakeholders during Skype calls.
MS Office + MS Visio. You can gather background information in Word, analyze it in Excel, make presentations with PowerPoint. But you still need MS Visio for creating flowcharts and UML diagrams. This combination fits small-to-medium projects with no need for continuous collaboration.
Сonfluence + Jira + Draw.io or Gliffy. Confluence and Jira work together perfectly, boosting communication between BAs and development teams. You can easily switch between the tools and share documents. Both Draw.io and Gliffy have plugins for Confluence, so the diagrams created with these tools are easy to insert in Confluence pages. The toolkit covers almost all BA tasks but is pricey for projects on a shoestring budget.
Jama Connect + Google or Microsoft Suite + Lucidchart. Jama Connect can handle the requirements of the large systems. However, it lacks embedded functionality for developing rich texts, tables, and charts.
Any of these combinations can be reinforced with Miro and Balsamiq or Axure XP, which are especially useful at the discovery phase. Explore different options in real practice — and you’ll come up with the perfect match.