This is a guest article by Benoit Ratinaud from WeDploy
In the wide-ranging field of Revenue Management (RM), three key metrics stand out: occupancy, average rate, and revenue. These have been the mainstay of RM for a long time, guiding decisions in many areas. From busy hotels in London to airlines flying through the skies, these numbers have always been markers of success. But as we often hear, the strategies that got us here might not be enough for the future.
The 21st-century market is changing rapidly, with lots of data and advanced analysis. This means we need to look at things differently. While occupancy, average rate, and revenue give us a basic understanding, they're just the starting point. There's more to consider, like customer behavior, demand patterns, and issues with overbooking or not using resources fully. All this calls for a broader approach to RM.
This article looks at more than the usual ways of doing RM and calculating hotel metrics. We're going to explore new strategies and find metrics that do more than just give insights. They'll provide practical ways for businesses to grow, become more efficient, and lead in their industries.
The conventional approach
The triad: occupancy, average rate, and revenue
At the heart of traditional revenue management, we push three principal metrics: occupancy, average rate, and revenue. Compared to budget or n-X, for years, these numbers have served as the compass guiding businesses in their quest for profitability and growth.
First, the occupancy itself is a very basic but easy-to-understand KPI. Against a given capacity, we’re talking about occupancy rate (OR percentage) or load factor (LF percentage), giving us the first indicator of demand performance for a given product or market.
Second, the average rate. We calculate it by dividing revenue by the number of units sold. Fluctuations in average price can indicate changes in market dynamics, shifts in seasonality, or the impact of promotional activities.
We are then able to deep dive a bit through segments or channels, helping us to identify the ideal mix. Volume multiplied by average price provides us with the total revenue generated. Obviously, a must-know for every single company: What’s my topline, and how did I achieve it? (E.g., Through occupancy or rate).
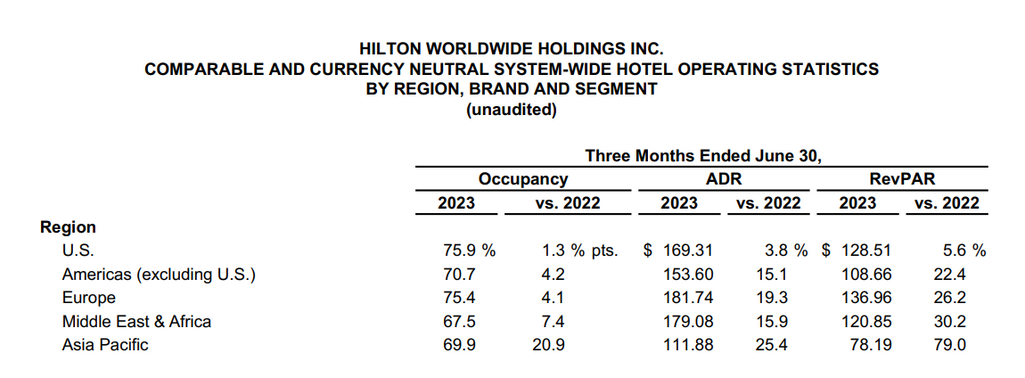
A common presence in various industries is RevPAR or revenue per available room. Replace the R with whatever the capacity is -- train or seat/hour for restaurants, car rental, distance, timeslot, number of staff -- the approach is fair and understandable by everyone.
Inherent limitations of the triad
While foundational, the triad isn't without its limitations. Solely focusing on these metrics can lead to the following biases:
Oversimplification. Businesses may miss out on nuanced insights, such as business mix or price efficiency. We are only looking at results without measuring the job performed against the competition. Worst, we are not looking at the path to build and achieve that.
Reactive decision making. Reliance on just these metrics might make strategies more reactive than proactive, missing out on future opportunities or threats.
Neglect of customer experience. While volume and revenue might soar, it doesn't always translate to satisfied customers. An overemphasis on numbers might overshadow the qualitative aspects of customer experience. Let’s assume that customer XP should be a common responsibility and not only owned by operations teams!
The never-ending comparison against budget, forecast, N-1, or N-X
As revenue managers, we often find ourselves at the crossroads of historical and real-time dynamics. There's persistent arm wrestling between what was forecasted, what was achieved in the past, and the actuals of the present. This comparison against benchmarks like the budget, forecasts, or previous years (N-1, N-X) is always a rite of passage. However, while these reference points offer some visibility, they might not always present the full picture in an ever-evolving environment.
Historical data offers comfort. It's tangible, definite, and represents known territory. When RMs compare current performance against N-1 (the previous year) or N-X (let’s say… 2019?), it provides a semblance of understanding, a yardstick against which success or failure can be measured. Budgets and forecasts, too, are grounded in past patterns, offering a roadmap for the future.
While historical benchmarks are valuable, an over-reliance on them can be limiting:
Changing market dynamics. The business landscape is fluid, influenced by myriad factors like holiday shifts, new/refurbished competition, pandemics, geopolitical events, and market disruptions. A strategy that worked in year N-1 might be obsolete or less effective in the current year.
Unforeseen challenges or opportunities. No forecast can predict every twist and turn. Be it a pandemic or a sudden market boom, strict adherence to past benchmarks can render RMs unprepared for the unexpected.
Stifling innovation. By continuously looking in the rearview mirror, you risk not seeing what's coming at you, missing out on innovative strategies or new revenue streams that don't fit the mold of past patterns.
The same story applies whenever your boss asks you about the budget variance.
Budget is here to set an ambition, an objective following strategic actions that will enable you to achieve it. You define it 3 to 12 months in advance, but let’s be frank, we can’t expect to land close to your projections. And having a different trajectory doesn’t necessarily mean that your RM performance is poor (…but it can sometimes!)
So what do we have left?
Advanced commercial KPIs and financial metrics: beyond just revenue
Revenue managers today are expected to look globally, not only focusing on a given department's revenue. They should develop this growth mentality helping to reach every single department of a business.
That led us to the introduction of additional KPIs like total revenue per available room (TRevPar) and gross operating profit per available room (GOPPAR), which was actually introduced a couple of years ago. The need is obvious for all, but still, today, only some revenue managers are really using them.
The reason behind it? It’s difficult to merge data at the right level of granularity and there's a lack of tools to manage rates and inventory properly.
Total revenue per available room (TRevPAR)
Hotels might earn extra from spa services, in-room dining, event spaces, or parking revenues. By recognizing and optimizing these opportunities, businesses can significantly boost their bottom line without overhauling their core offerings.
The same applies to other industries: Airlines generate significant ancillary revenue from baggage fees, seat upgrades, inflight entertainment, or other purchases. Low-cost Frontier Airlines was telling us they’re able to generate an astonishing $82 per passenger on top of booked flights. For Spirit Airlines, ancillaries represent more than 50 percent of their total revenues, while it tends to be around 30 percent for European low-cost carriers (Ryanair, WizzAir). Focusing on a single source of revenue is nonsense.
Across Ennismore’s 100 lifestyle hotels, there are 190 restaurants and bars that generate approx. 50 percent of total revenue.
Other indicators help us to understand RM and operational efficiency: upgrade percentage, upsell percentage, sell efficiency, conversion rate percentage, and discount percentage. While revenue managers are not always fully responsible for those, it's crucial to involve them in building strategic actions to ensure that global revenue is optimized.
To go even further, while technology and data are still true barriers to optimal business monitoring in the hospitality industry, we observe some initiatives to introduce more granular KPIs eventually. From an investor perspective, TRevPAR is great, but we could also imagine a comparison of revenue based on the available commercial surface (E.g., revenue per available square meters, for example, taken from the retail industry). It makes sense to prioritize and focus efforts on low performers or high potential while having several properties on a given scope.
Another KPI that dives deeper into the financial aspect is GOPPAR.
Gross Operating Profit Per Available Room (GOPPAR)
Revenue, while indicative of growth, doesn't paint the complete picture. GOPPAR, on the other hand, considers operational costs, providing a clearer glimpse into profitability. Factors such as staffing, maintenance, marketing, and other operational expenditures come into play, offering a comprehensive view of
- cost management efficiency,
- profit margins, and
- areas of potential cost optimization.
How much does an airline make per passenger?
We might see high revenue numbers, but if fuel costs, staff salaries, and maintenance aren't managed effectively, the GOP might be unsatisfactory (even though the average is hiding disparities, worldwide 2023 net profit per passenger is forecasted at about $1.11).
Responsible for the profitability of your business, your CEO is reading the business from a topline and a bottom-line perspective, so you should too.
As we peel back the layers of modern RM, it becomes evident that the conventional triad, while foundational, is just the beginning. Additional metrics like RevPAR and GOPPAR offer businesses a lens to view their operations holistically, ensuring not just growth but sustained profitability. True, high revenue doesn’t mean profitability, but empirical studies tend to prove the correlation.
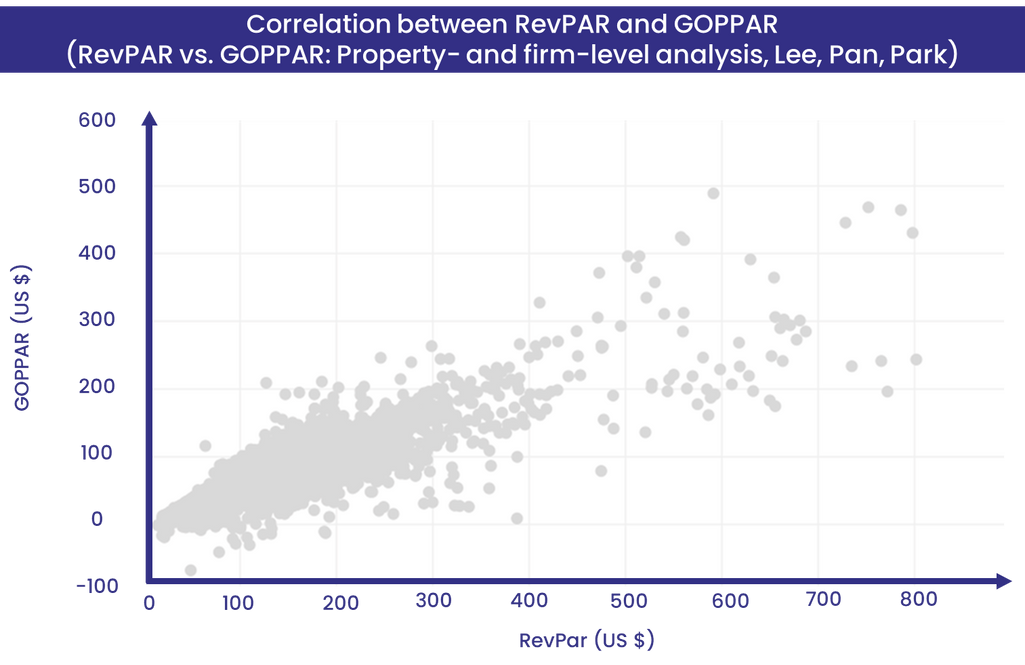
RevPAR vs. GOPPAR: Property and firm-level analysis. Source: ResearchGate
Net average rate and net revenue
In the same trend, net KPIs have been appearing over the past decade following the rise of OTAs. Businesses often grapple with the balance between direct sales and third-party channels. While direct bookings, such as reservations made through a hotel's official website, offer higher profit margins, third-party platforms like OTAs might provide a broader reach. Indeed, some distribution partners would cost you up to 25 percent, so why continue to consider the overall topline without including those fees?
Talking about fees, remember to include ALL types of fees that you might offer to them:
Commissions fees. Regular percentage commission based on product sold.
Visibility boosters. Additional commission percentage or cash spent (e.g., Booking Sponsor Ads, Preferred Partner Program, Expedia TravelAds)
Discount booster. Additional discount percent is given for a specific product (e.g., mobile discount, package, flash sale)

Now that you have all the cards in your hands, are you able to compute your net ADR by Channel? 😊
We’ve actually seen many additional metrics. Let’s be frank, we don’t need those on a daily basis as the trend won’t change from one day to the next. Still, having those surely helps you to not only optimize your revenue for tomorrow but also to build a mid- and long-term strategy.
Forecast demand, spillage, and spoilage: the modern revenue management challenges
Why do those metrics matter? Revenue Management isn't just about numbers; it's about understanding market dynamics, anticipating changes, and ensuring we continuously improve our performance through iteration. Let’s see how the forecast, spillage, and spoilage KPIs could help with that.
Decrypt demand patterns
Forecast accuracy: A critical pulse-check, booking pace measures the rate at which reservations or sales are made for a specific period. A sudden acceleration might indicate an upcoming event or seasonality, while a slowdown could signal market saturation or increased competition. Having a full anticipation of the demand is always a tricky exercise.


Whatever the logic used behind it, in this rapidly changing environment it would be difficult to assess accurately the coming demand. Michael J. North & Charles M. Macal (2007) would consider a forecast as “acceptable” if it falls between a range of 3-10 percent. More specifically for revenue management, in my past experiences, it was often said that a 3-5 percent maximum variation would be OK (then it always depends on the expected granularity, doesn't it?)
Looking at airlines, Anthony Owen Lee summarized in 1990 that a 10 percent increase in forecast accuracy would boost revenue by 0.5 to 3 percent on high-demand flights.
The twin challenges: spillage and spoilage
Spillage: It's the opportunity lost when demand overshadows supply. We talk about an inventory that hasn’t been protected correctly. An airline that consistently turns away passengers as reaching their capacity too fast, or a theatre that regularly sells out would be facing a spillage situation.
While on the surface, this seems positive, it indicates potential revenue left on the table or, worse, handed to competitors. For a given hotel, let’s imagine that the average lead time is four days, and you realize 10 days prior to D-Day that your inventory is already sold out. How would you react?
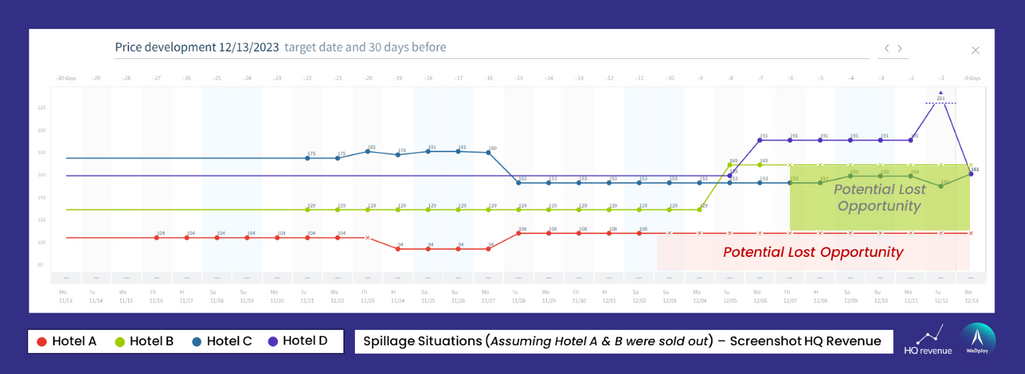
Spoilage: On the flip side, spoilage signifies an unsold and overprotected inventory. In simple words, it refers to lost revenue opportunities because prices were set too high, causing potential customers to decide not to book.
Every vacant hotel room or empty seat at a concert is not just lost revenue but a missed opportunity to enhance customer experience. That could be observed if the pricing has been too ambitious or hasn’t been adjusted at the right time. Over time, high spoilage can erode brand value and customer trust.
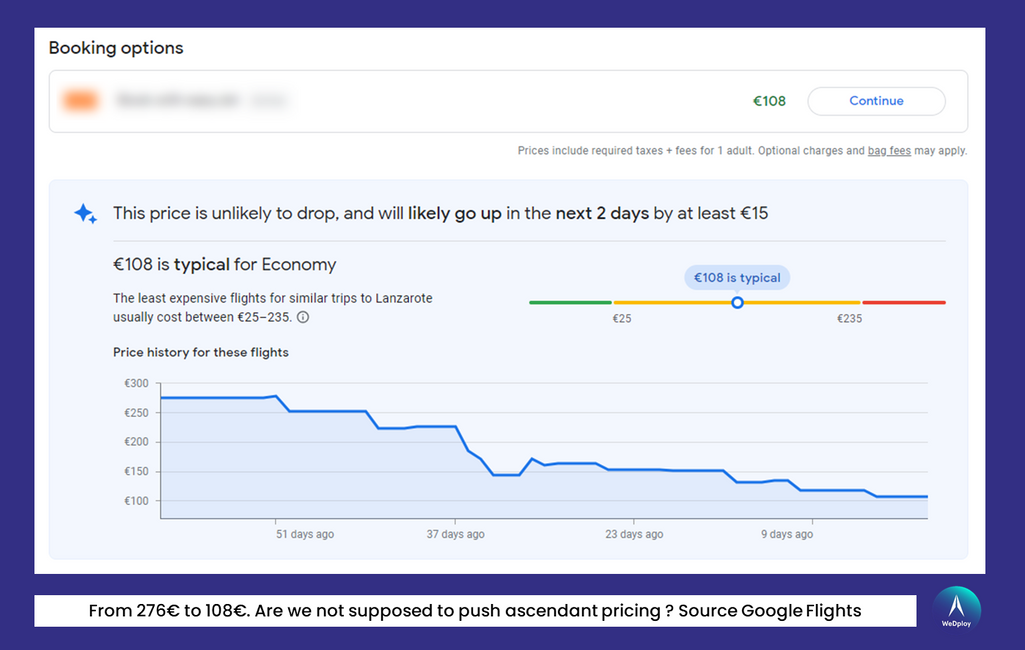
An airline gradually drops prices to avoid spoilage. Source: Google Flights
Let’s summarize spillage and spoilage scenarios.
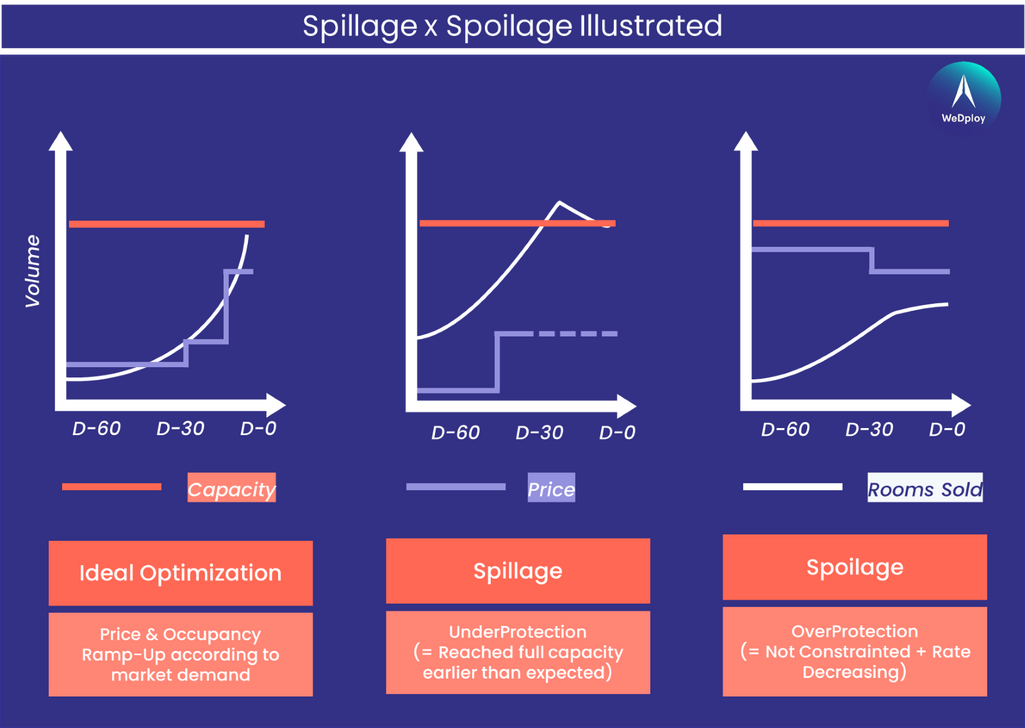
About the spoilage situation: we should have in mind what occurred during 2012 Olympics Game in London, where somehow the market was overpriced and hotels started to drop down prices at last minute:
It’s a great event; great publicity for the country, but what we need is sensible hotel pricing, and to make sure it goes back to normal very quickly. There’s plenty of availability in London, more than enough hotel rooms, but rates have to be commercially viable.
A similar situation happened during the latest 2022 World Cup in Qatar. According to Lighthouse (ex-OTA Insight), fare rates have been decreasing over the region between October 17 and November 9. While rooms were still available, and as we got closer to the tournament beginning (November 20), hoteliers needed to react to ensure they would be able to fill up their rooms.
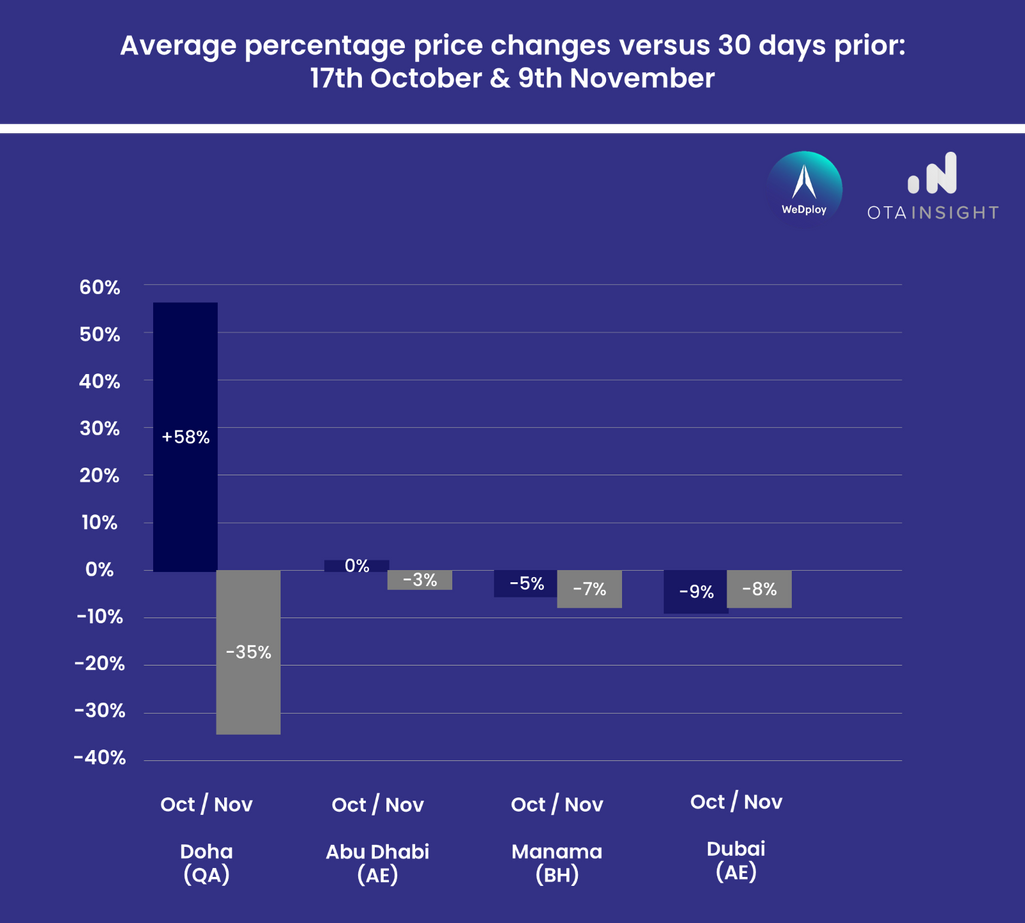
Hotel price changes during the 2022 World Cup in Qatar. Source: Mylighthouse.com
I voluntarily took major events to illustrate those situations, and that can speak to all of us. By experience, even in a more stable environment, WeDploy observed that spillage and spoilage situations are more present than what we can imagine: You can improve only what you measure!
How to compute spillage and spoilage?
Let’s be honest, there is no standardized recipe to generate or highlight those KPIs. The difficulty is to compose various data sets with different snapshot dates. It will also depend on your industry, booking window patterns, your ability to adjust the capacity or not…
Here are a few methodologies for the hospitality/transport industry.
Spillage [UnderProtection] approach 1:
- Data Collection: Monitor the number of inventory requests or bookings that couldn't be fulfilled due to full capacity. This data can typically be sourced from your booking engine.
- Analysis: Compare daily booking requests with seasonal averages. If you notice spikes in requests on days when the occupancy percentage exceeds 95 percent, it likely indicates a missed opportunity. In such cases, there might have been a delay in adjusting room availability or implementing booking restrictions.
Spillage [UnderProtection] approach 2:
- Data Collection: Track the lead time (number of days before the actual stay date) for bookings on days with high occupancy (Occ. percentage > 95 percent).
- Analysis: If the lead time for these high-occupancy days is significantly higher than the seasonal average, it suggests potential underprotection. It means the hotel might not have reacted quickly enough to accommodate the surging demand.
Spoilage [OverProtection] approach 1:
- Data Collection: Track publicly available room rates for historical dates, spanning from 30 days prior (D-30) to the day of (D-0). Highlight instances where there's a downward trend in pricing.
- Analysis: Cross-check these instances with specific business dates where occupancy (Occ. percentage) falls below 70 percent. Such occurrences may pinpoint days when pricing was set too ambitiously, resulting in missed opportunities due to not adjusting rates in a timely manner.
Spoilage [OverProtection] approach 2:
- Data Collection: Monitor rate categories or distribution channels that were previously closed but then reopened as the date approached, covering a range of 30 days before (D-30) up to the actual day (D-0).
- Analysis: Compare these instances with particular business days where the occupancy rate (Occ. percentage) was less than 70 percent. Such patterns might indicate periods when initial rate decisions were overly optimistic, leading to potential revenue loss due to the delay in adapting pricing strategies.
Now, ensuring you can correctly fix those cases requires:
Advanced forecasting. Have the correct tool/information/resources at your disposal to make an accurate forecast. That’s your GPS. That’s how you will define which roads to take to drive from A to B.
Dynamic pricing. Reviewing potential pricing business rules to ensure they don’t underprotect or overprotect your inventory!
Feedback mechanisms. Regularly gathe feedback from RM teams, and more globally to eCommerce, marketing, and sales, but also front-line staff and customers that can offer ground-level insights!
The challenges of demand forecasting, spillage, and spoilage are emblematic of the complexities of modern Revenue Management. However, with the right strategies, tools, and insights, businesses can navigate these challenges, ensuring optimized revenue, enhanced customer experience, and sustained growth.
The Future of Revenue Management
As we journeyed through the multifaceted world of revenue management, we unearthed its complexities, opportunities, and the continual evolution it undergoes. From the foundational KPIs of occupancy, average rate, and revenue to the transformative power of advanced analytics, the RM landscape is as vast as it is intricate.
While the traditional metrics provided the bedrock for early RM strategies, we recognize their inherent limitations. The dynamic business world demands a more holistic approach. That includes performance variance against a given reference (historical data, budget, forecast), and an understanding of the global performance, including all revenue streams and costs (TRevPar, GOPPPAR).
We also could have covered other relevant metrics such as market share performance (revenue generated index) or competition pricing analysis (lead rate index), which are commonly used today and are helping understand market performances.
After deploying an RM initiative, it's crucial to assess its efficacy. This post-implementation review, anchored in metrics, can answer questions like:
- Did the new pricing strategy boost sales?
- How did the introduction of a loyalty program affect repeat bookings?
- Was the promotion during the holiday season successful in reducing spoilage?
We saw the advantages of measuring RM Performance through those indicators. They are business-oriented, and they can spot room for improvement through patterns of recurrence.
It’s fair to say today that more and more revenue managers are expected to spread their vision and strategy more globally. That’s an expectation from top management to ensure that everyone is involved and has adopted the strategy.
Could we imagine tomorrow having an internal NPS for employees focusing on revenue management? Colleagues, do we all understand the RM strategy in place? How are we all familiar with the actions?
Revenue management transcends being a simple business operation; it is a complex discipline. It requires a fine balance between detailed number analysis and strategic insights, aligning business strategies with client sentiment, and integrating concrete data with informed decision-making. As the business world evolves, the core purpose of Revenue Management remains consistent: to enhance revenue potential while prioritizing customer satisfaction. This process is akin to a coordinated blend of statistical analysis and narrative progression, often backed up with revenue management systems and/or business intelligence solutions.
Are you already monitoring your spillage and spoilage ratio? Which additional focus would you add to those? Share your stories with us!

Benoit Ratinaud, a seasoned expert in the tourism sector, brings a decade of rich experience from his time with industry leaders like Hilton, Louvre Hotels Group, BlaBlaCar, and TheFork. His journey in the field has shaped two core convictions: the untapped potential of revenue growth levers in the industry and the need for technology to play a more significant role in boosting productivity. Benoit and WeDploy are equipped to provide comprehensive support for both strategic and operational aspects of revenue management. Reach out on LinkedIn or on WeDploy Website.
Want to write an article for our blog? Read our requirements and guidelines to become a contributor.

