

Traditionally in our holiday-themed blogs, we look at all types of technology from gift-bearing drones and healthy tech habits to a century-old history of travel tech. Yet this year we don’t want to spread ourselves too thin, because we want to acknowledge one area of technology that impacts our lives in so many different ways.
Businesses everywhere build pipelines to pump data like the most valuable fuel it is. They create virtual warehouses to store it in, invisible infrastructures to support its travels, and apply algorithms to help it transform into something tangible. Each like and tweet, each genome and test result, each parameter about yourself, or your car, or the app you use -- all of this information matters if we know how to use it.
We announce that 2021 will be the year of data for AltexSoft. We want to deepen our data expertise, share more data-related content, and engage in more projects where we can help organizations use data better. So we welcome Vladimir Kuzmenko in his new role of Managing Director for our Data & Analytics operations where he will help us and our clients grow.
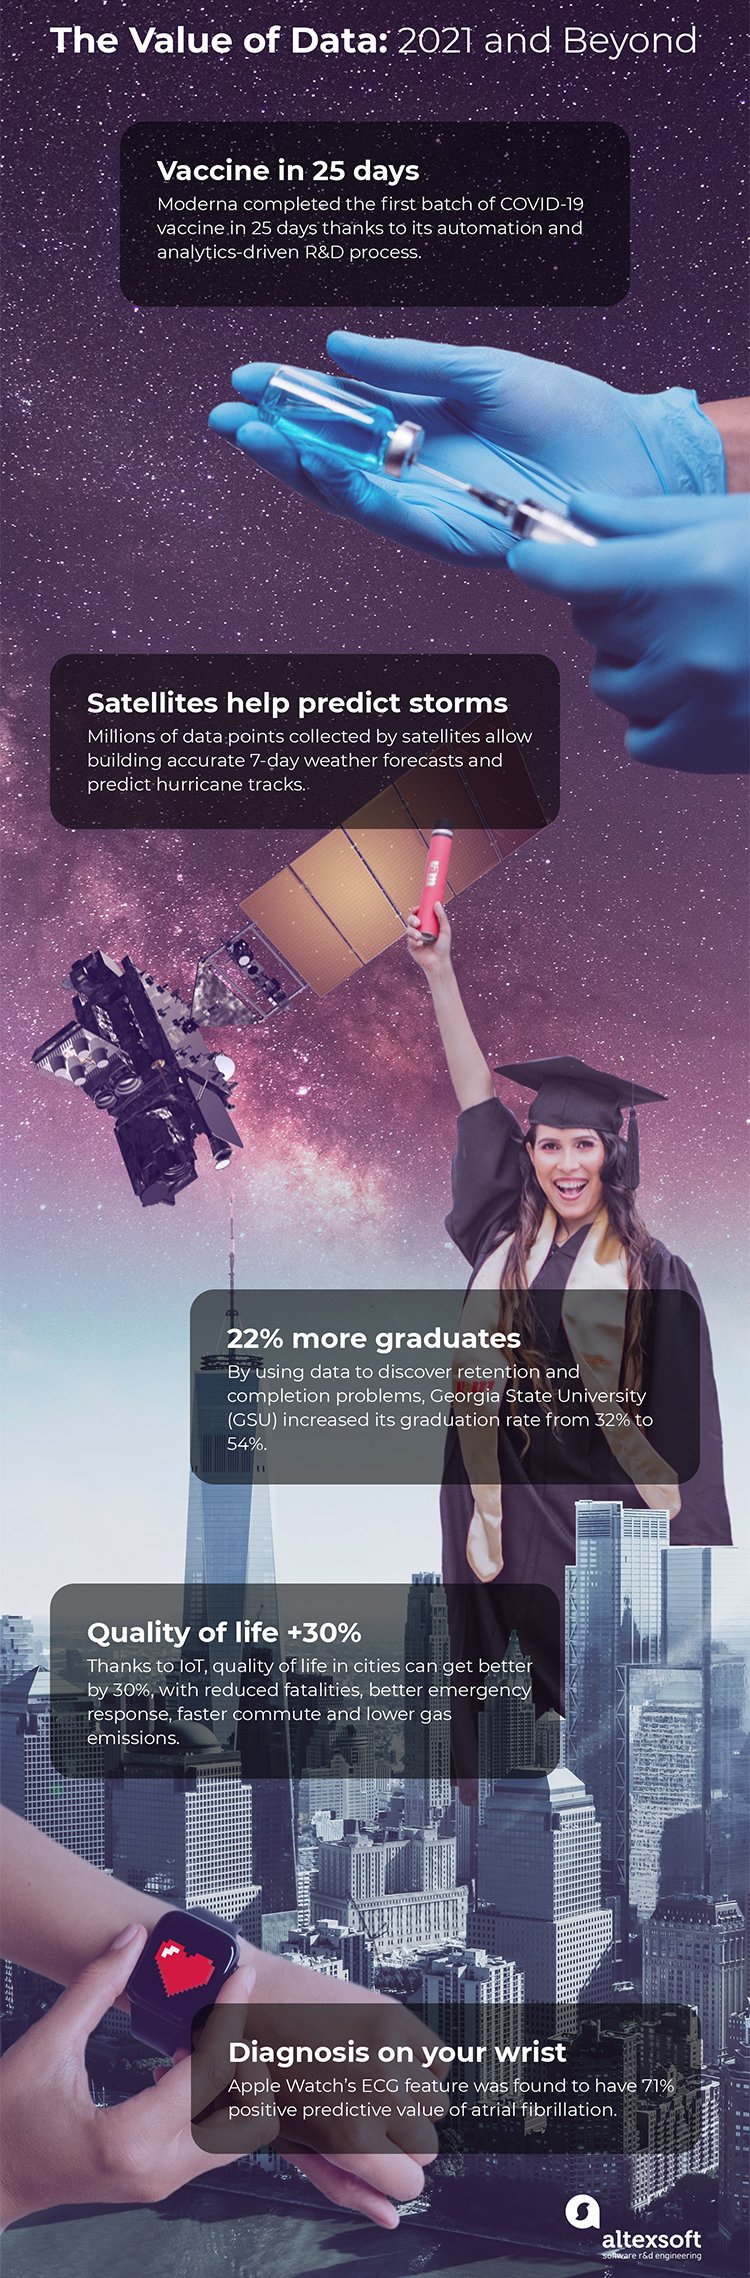
We believe that if there’s data, there’s something to learn from it. And it’s often so valuable that it can change the world. Here are some of the most prominent examples of how. Scrolling down to the end will bring you to our infographic on the topic.
Automation and analytics speed up the COVID-19 vaccine discovery and distribution
You can’t spell vaccine without AI. This was proven by Moderna, an American biotech company that announced the development of the first candidate for COVID-19 vaccine back in February 2020. As of today, Moderna’s vaccine is proven to be 94.5 percent effective and it should be FDA-approved and distributed across the US by April 2021.
Moderna’s unprecedented speed was largely enabled by its unique R&D ecosystem of tools. For example, a big challenge in the early stages of clinical trials comes from lengthy collection and processing of large amounts of data from patient targeting to identifying potential active compounds. Moderna’s 20-year long research into mRNA projects provided them with large quantities of replicable data and automation, cloud computing, and Internet of Things devices allowed them to provide scientists with easy access to that data.
Although Pfizer’s vaccine has been already approved in the UK and Canada and is expecting FDA’s decision, Moderna announced a significant advantage of their vaccine -- unlike Pfizer’s vaccine that must be stored at a -70C (-94F) and shipped in a special box, Moderna's can remain stable at standard refrigerator temperatures for 30 days. This fact alone will streamline the vaccine shipment and deployment, compared to logistical challenges Pfizer is currently facing. Moderna believes that their investment in technology and automated manufacturing played a vital role in this advancement.
Smarter, safer, and more sustainable living in data-driven cities
Smart city has been a buzzword for years. And just as long, it’s been a reality. If you live in a big city, you might have experienced its benefits yourself. When looking for a public toilet via an app. Or checking with Google how long it will take for your bus to arrive. Or, if you reside in Amsterdam, it might’ve even helped develop some smart city projects.
Amsterdam owes its status as the world’s “smartest” city to the network of sensors (cameras, beacons) and actuators (traffic lights, charging stations, and barriers). They collect data about the environment, preprocess it, and then perform the requested actions, like switching from red light to green or controlling public lighting to save energy.
One of the larger implementations for Amsterdam is transitioning to circular economy -- a system where resources are continuously reused and recycled. For example, 75 percent of waste from the city’s sewage system is already converted into natural gas. These efforts are made possible through the collection of data about resource streams -- companies are obliged to report their waste streams, so the city knows what happens to it and then can analyze it.
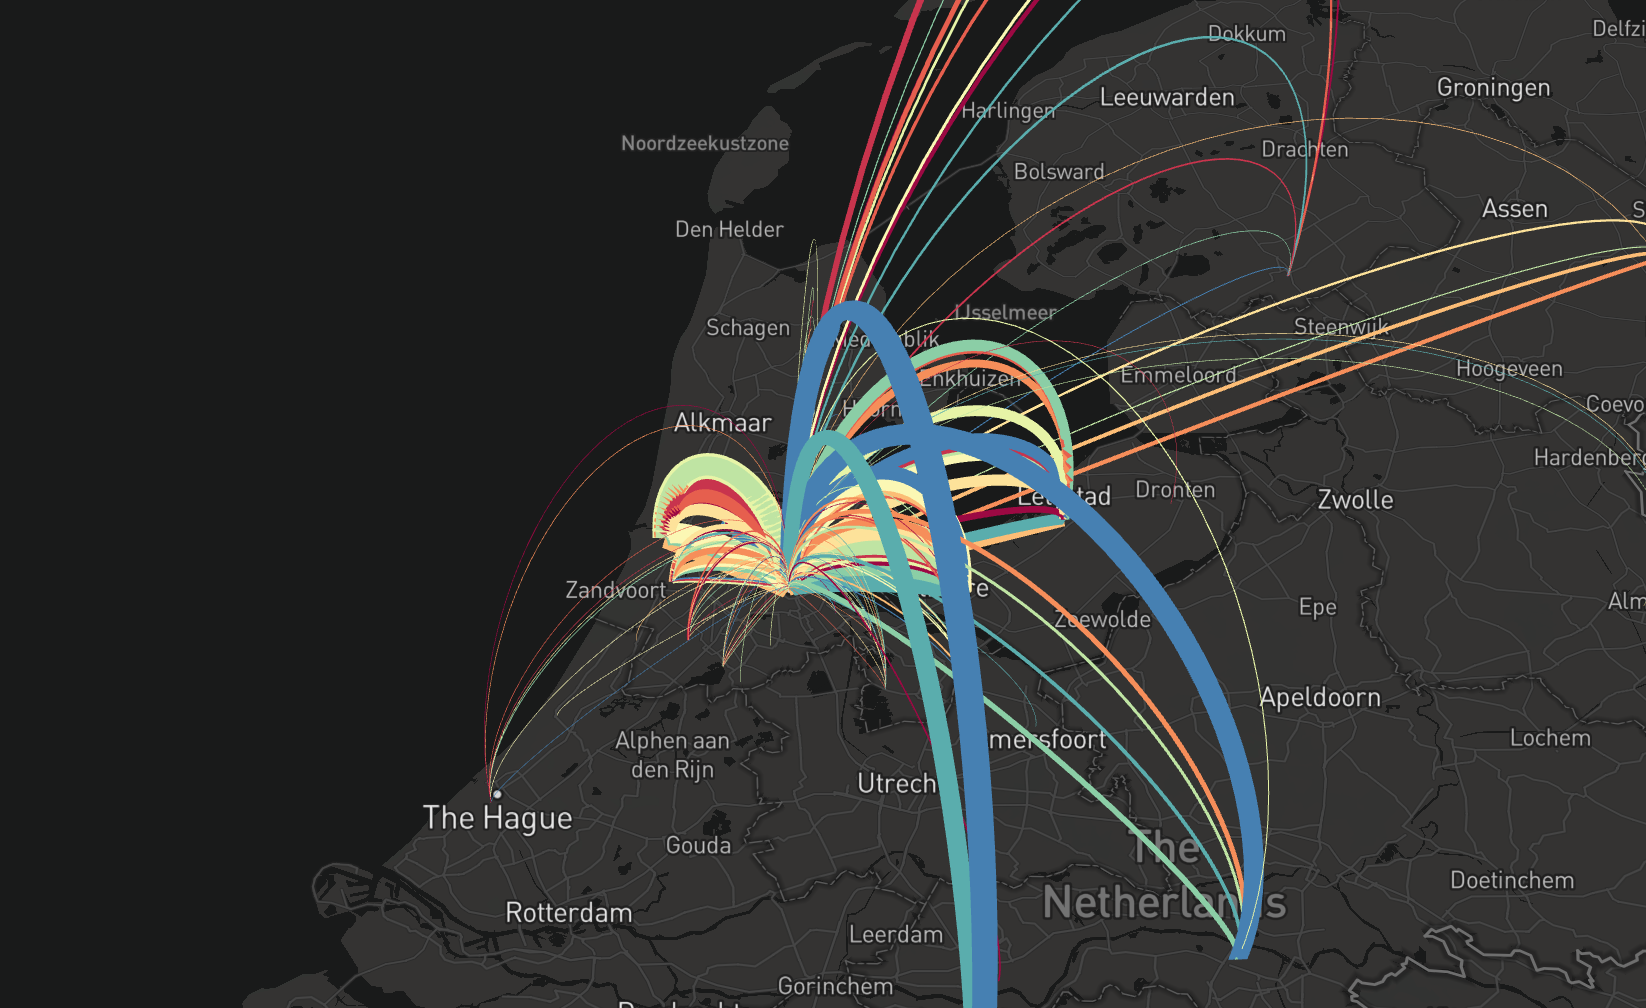
All waste produced in the Amsterdam Metropolitan Area and where it’s processed; colors indicate different economic sectors
Source: TUDelft
“How much waste does the city of Amsterdam produce; which companies are responsible for the largest emissions and which materials that are currently incinerated have the greatest potential for reuse? The platform can answer such questions in an automatic, data-driven way," says Arnout Sabbe, environmental technology researcher at Delft University of Technology. This way, the municipality calculated that 70 percent of waste comes from 7 percent of companies.
Another smart city pioneer is Barcelona. Installing over 19,500 sensors to collect data about air quality, trash disposal services, parking situation, street lighting, noise, the presence of people, and more, the city managed to improve the quality of life and save money. For example, receiving the live data on temperature, humidity and sunlight, gardeners are able to determine what each plant needs and avoid overwatering.
McKinsey estimates that citizens of smart cities have safer and more fulfilling lives: Surveillance and image recognition leads to lower crime rates; smart traffic management, parking, and predictive maintenance of roads reduces time spent in commuting; energy consumption and mobility lower the cost of living.
Wearables promote health awareness and notify of medical problems
Counting steps, checking the volume of consumed water, or tracking your sleep is now increasingly common with wearable technology becoming a $95 billion industry. And wearables (smart watches, fitness trackers, heart rate monitors) are just a part of the huge ecosystem of self-tracking tools: there are smart body scales, connected thermometers, running shoes, and sex toys.
Although we do self-tracking mostly out of curiosity, these devices can give warning of possible health abnormalities, save lives, and even solve murder cases.
Apple Watch, the world’s most popular smartwatch with 55 percent of market share, has the highest track record of nudging people to seek medical attention. A Stanford study revealed that the device has at least a 71 percent predictive value of atrial fibrillation -- 84 percent of study participants who received notifications about irregular pulse were found to be in atrial fibrillation at the time. More than half of those participants sought medical attention afterwards.
Although self-evaluation may lead more people to overutilize healthcare resources, patients can at least pay attention to other symptoms when getting an unsettling notification. A recent study reviewed clinical notes from the Mayo Clinic. They revealed that over four months, almost 600 patients visited the clinic due to an Apple Watch alert.
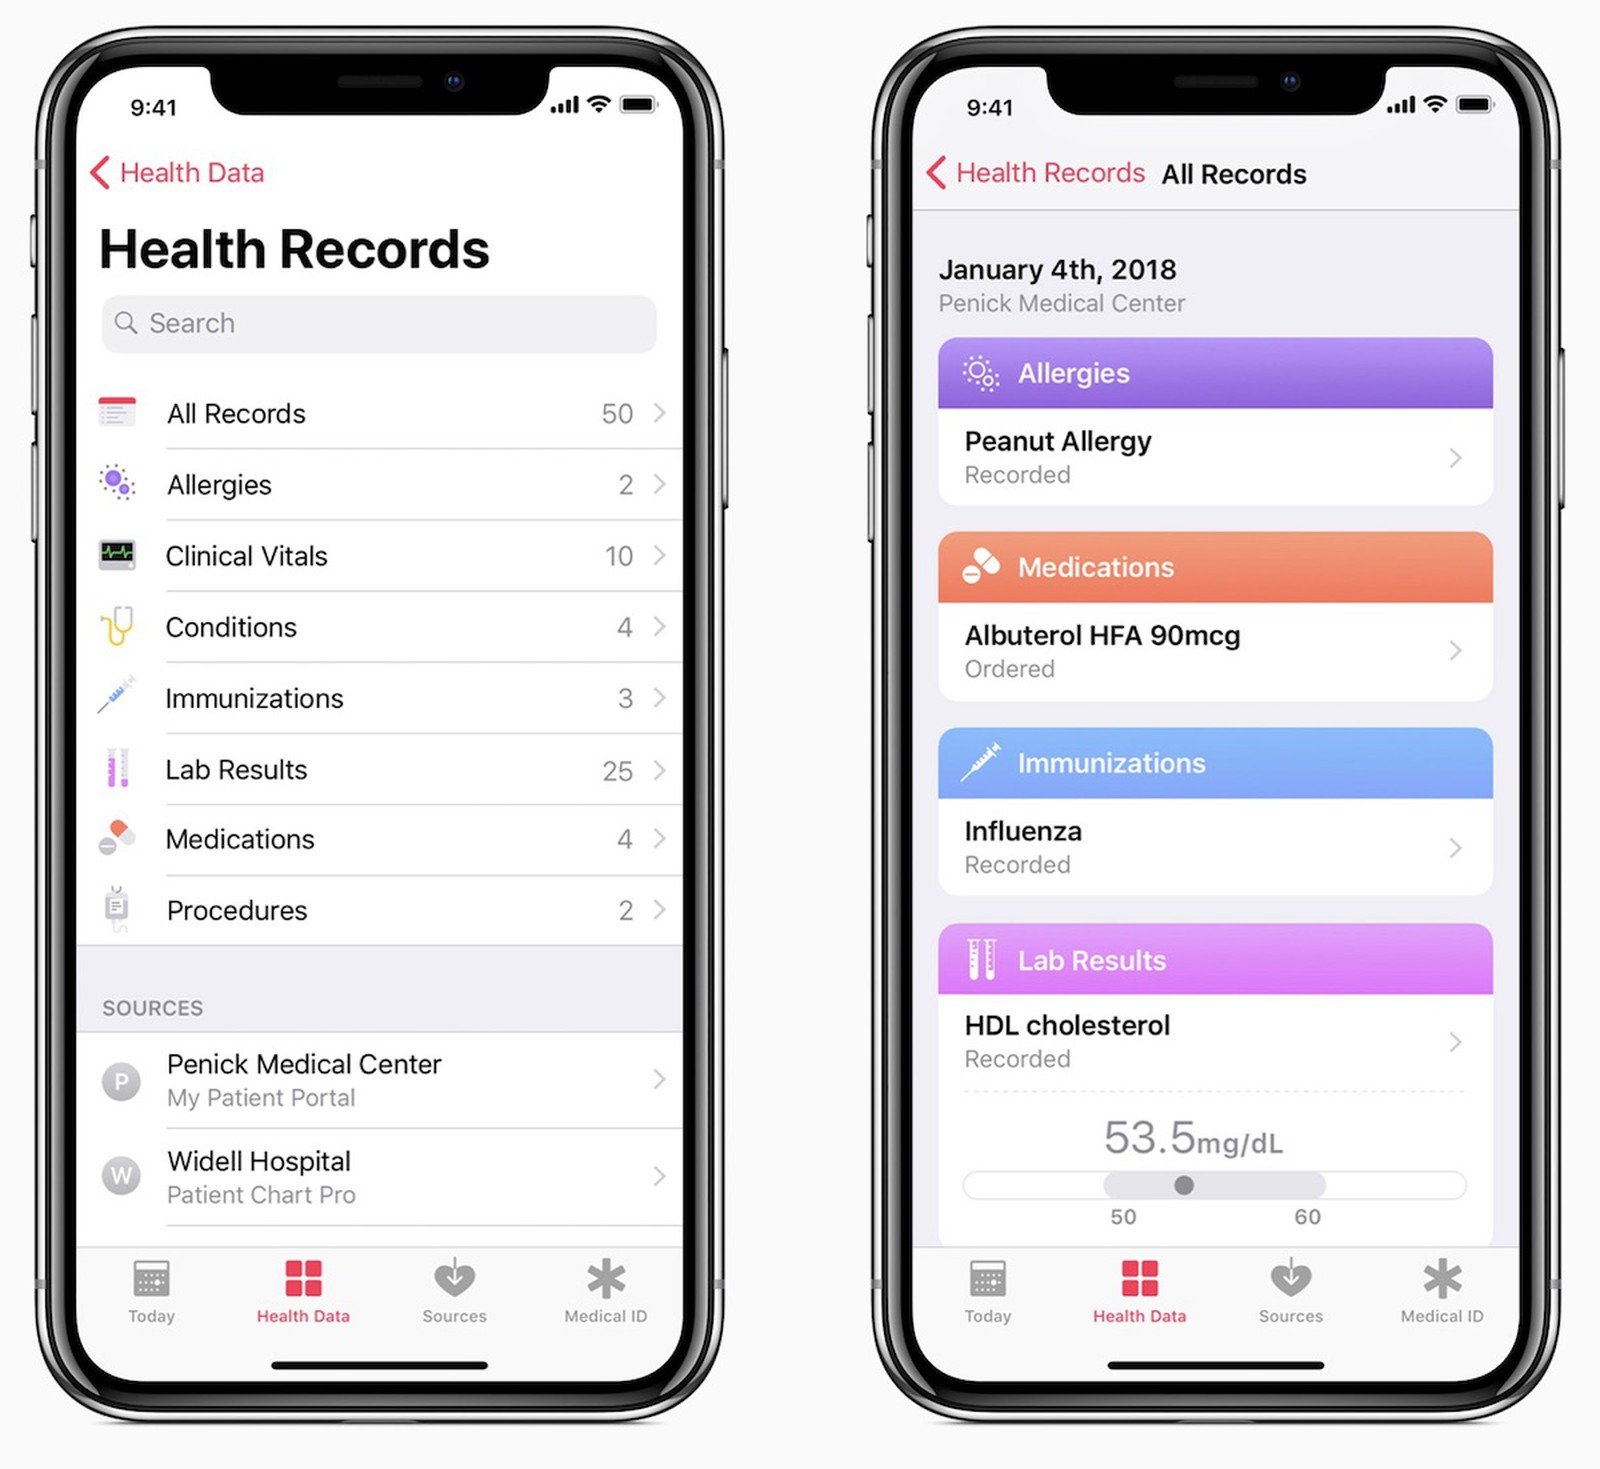
Apple Health Records allow iPhone and Apple Watch users safely exchange medical data with selected hospitals
But there are even bigger opportunities at hand. Currently, Apple has a list of 500+ institutions supporting the connecting between Electronic Healthcare Records and the Health app on your iPhone. With 1 in 5 Americans already using smart watches or fitness trackers daily, we can expect the growth of health awareness and involvement in the population. If we can equip patients with chronic and dangerous diseases with the capability of tracking their health in a user-friendly manner, we can make their lives more comfortable and position them to practice better care.
Data analytics gives students a better chance of success
The educational environment is extremely data-friendly. Some processes have long been digitized and student data is already being used in numerous helpful ways. One of the most innovative schools to do so has been Georgia State University.
GSU traditionally had a low graduation rate of less than a third of its students. Besides, since the school attracted large numbers of students with other priorities like work or parenting, there was an even lower success rate for them. Luckily, the school was pretty good at keeping its data clean and storing it in a data warehouse, which allowed them to start their first data-driven initiative in 1999 and continue with its data analytics projects to this day.
Namely, the analysis revealed which GSU courses had the highest chance of students dropping, failing, or withdrawing (DFW) from it. Each year 43 percent of students who took algebra, pre-calculus, and statistics didn’t complete the course. By adapting the course model and introducing an easier way for students to ask for assistance, they lowered the DFW rate of those disciplines to just 19 percent.
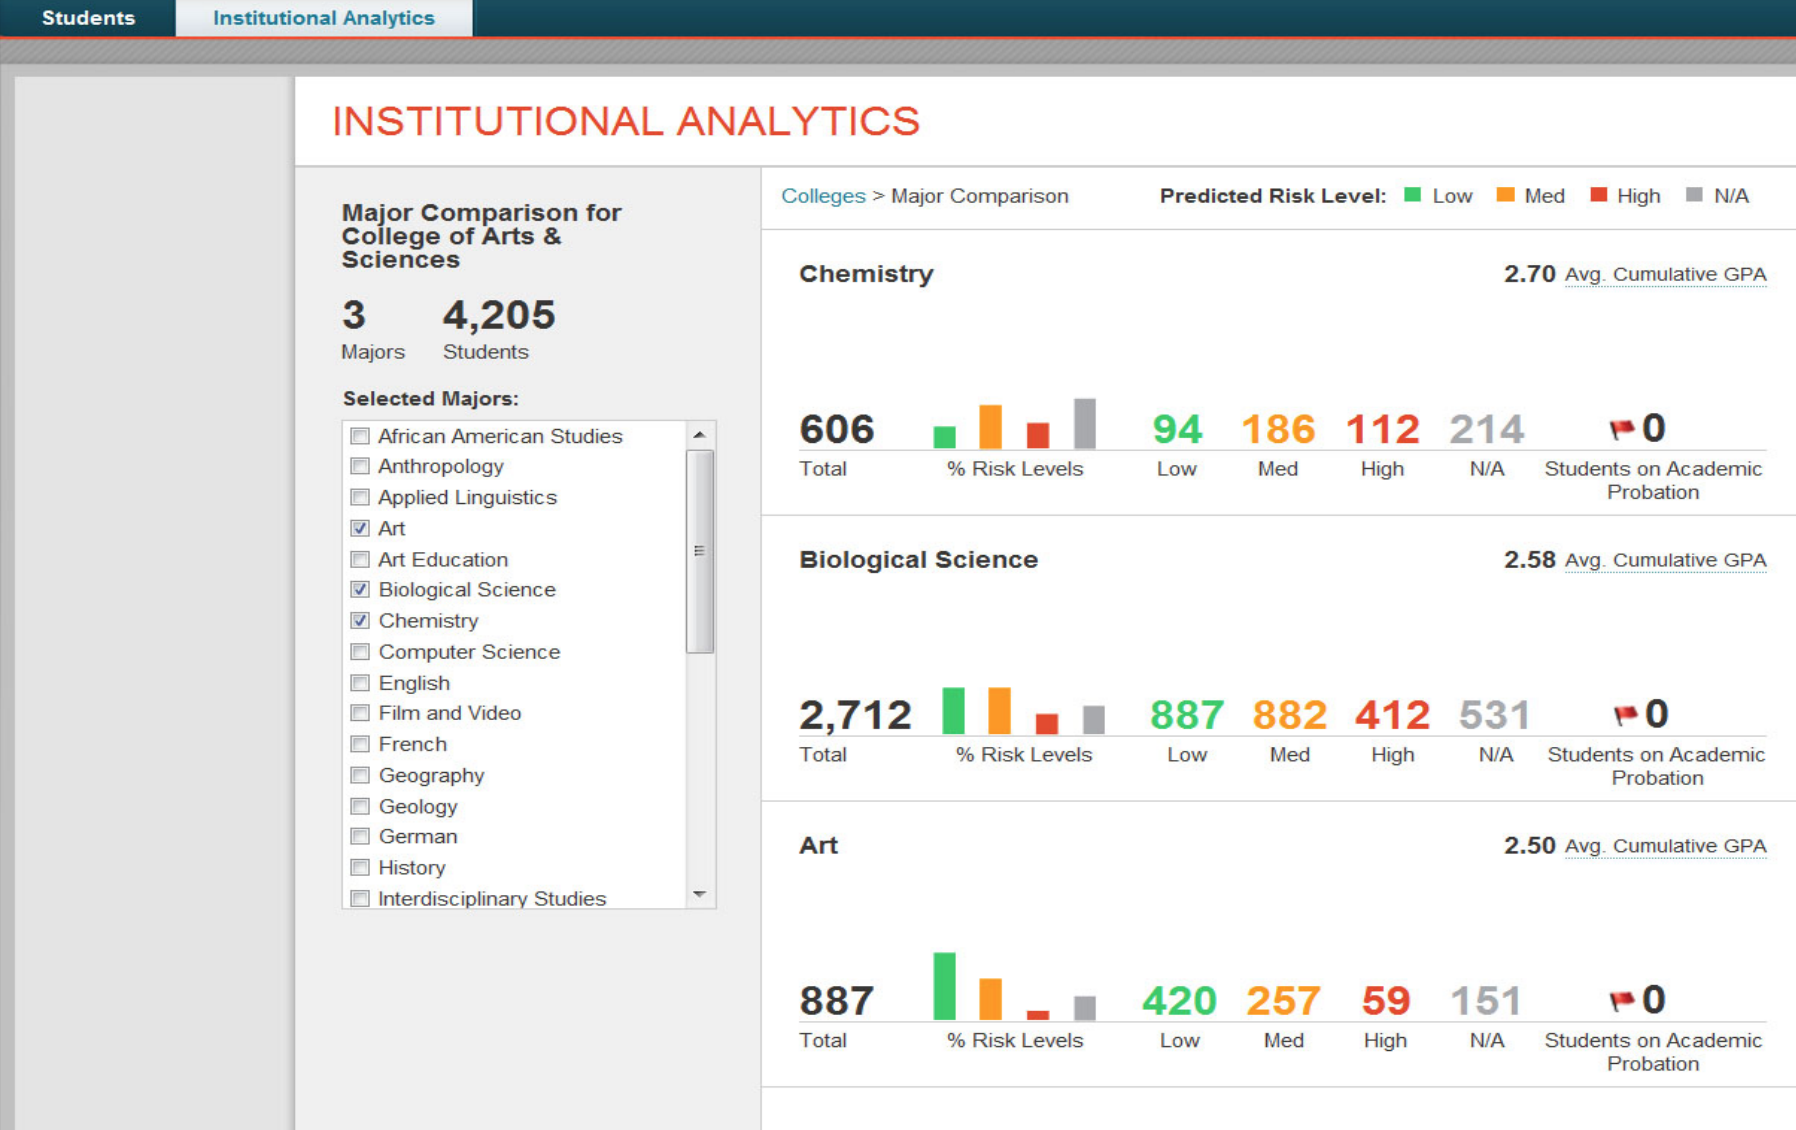
An analytical dashboard at Georgia State provides an outlook into low, medium, and high-risk students and generates alerts for advisors to act upon
Source: GSU
They also invested in the Graduation and Progression System (GPS) -- a dashboard displaying the real-time academic data of each student, which allows advisors to identify obstacles to success and intervene in time. This also means that their advice is no longer based on subjective opinion, but on clear data.
These and many other improvements allowed GSU to do better at their biggest problem -- from a 32 percent graduation rate in 2003, they reached 54 percent in 2014. And based on predictive data of student success, they launched an opportunity for the most at-risk freshmen to join the summer program before the first year. A higher score let previously underserved students apply for grants and start their education.
Although starting data analytics initiatives in schools comes with many challenges, we can move in smaller steps to achieve great results in just a decade. The GSU example shows that just by understanding the problems within the organization, we can find creative ways to make students’ lives better and success more attainable.
Getting better at predicting natural disasters with machine learning
Although we don’t yet yield technologies to prevent natural disasters, we get better at anticipating and responding to them every time.
During Hurricanes Irma and Harvey in 2017, numerous government bodies managed to apply prediction on the movement of the hurricane, its hotspots and flooding areas, allowing people to adequately prepare for the storm and increase awareness after the disaster happens.
This was possible thanks to the systems of sensors and satellite imagery that fed real-time data on roads, energy grids, bridges, and buildings to machine learning algorithms. Seeing this information, officials applied preventive maintenance and reinforced those structures that wouldn’t withstand weather conditions. To restore power faster, 20,000 professionals were sent to staging areas across both Carolinas prior to Hurricane Florence in 2018.
Effective data exchange and communication helped the City of Miami rescue residents during Irma. First by collecting information about vulnerable populations across the city and, second, by facilitating the crowdsourced map of available shelters and supplies.
The more data we collect from past incidents, the better at prediction we become. Using data from the 2018 floods in Japan, researchers were able to apply a machine learning model and identify the flooding areas of the future disaster, which were consistent with the results caused by Typhoon Hagibis a year later. Collecting, storing, and putting to use data from past disasters will make the response more effective every time, resulting in fewer casualties, better evacuation processes, and reduced losses.
Living during the Data Revolution
In 2011, the German government started a new project for promoting factory computerization. They called it Industrie 4.0, and the term soon got picked up by global manufacturers. In 2015, it became official: Klaus Schwab, executive chairman of the World Economic Forum, proclaimed the new technological era -- the Fourth Industrial Revolution or Industry 4.0.
Historically, industrial revolutions signify major changes in manufacturing, new innovative machines and methods to use them. The revolution that we experience today doesn’t have a formal name yet. But it’s characterized by automation and data exchange.
Data plays a pivotal role in all processes of smart manufacturing, development, and scientific exploration: Take any life area and you can find ways to make better decisions based on relevant data that’s flooding the world.
It is likely that this period will go down in history as the Data Revolution. Either way, it’s already started and we can’t wait to see the world to join in.

Maryna is a passionate writer with a talent for simplifying complex topics for readers of all backgrounds. With 7 years of experience writing about travel technology, she is well-versed in the field. Outside of her professional writing, she enjoys reading, video games, and fashion.
Want to write an article for our blog? Read our requirements and guidelines to become a contributor.