Choosing analytical software is no less challenging than data analysis itself since the business intelligence (BI) market provides an array choices. Deciding on the best fit for your analytical purposes requires wading through products that are not dissimilar. But the right choice is never in just one instrument. It’s more about the platform and the ecosystem your data inhabits.
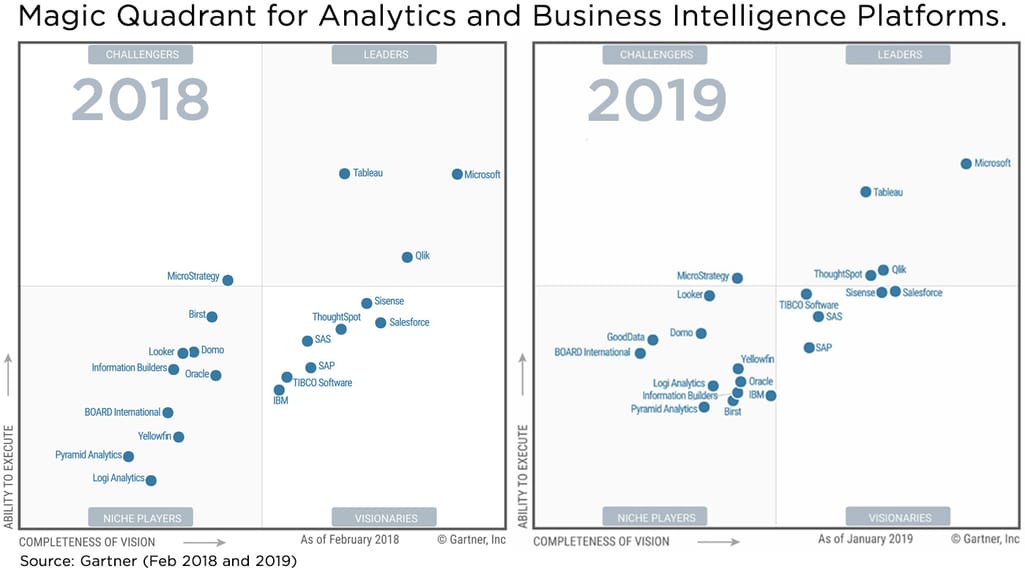
Microsoft (PowerBI) reaches the first position, while Tableau remains superior to Qlik
Technology vendors compete in their own arms race. By looking at Gartner’s Magic Quadrant, we can plainly see who the lead dog is: Microsoft’s Power BI remains the leader in 2020 as an analytical, warehousing, and data visualization platform. While not surprising for a behemoth such as Microsoft to remain king of the mountain, Tableau is holding firm to its market position.
Let’s have a look at the Tableau BI platform and explore why it’s considered one of the best options for data analysis. This article will provide an overview of Tableau products and their functionality. It will describe how separate tools can be used, and how Tableau has remained a leader of the BI market for seven consecutive years.
What is Tableau?
Tableau is a BI suite that debuted on the market in 2003. Its range of products includes mainly tools for online data processing, data visualization, and presentation. Among various data analysis activities, Tableau focuses primarily on data visualizations. In terms of user group, it suits both data analysts and business users.
The analytical interface of Tableau requires almost no coding knowledge for data querying and data viz creation. Tableau also supports sharing information across the organization with the help of dedicated servers. But as easy as it looks, the suite also presents a toolset for managing server/data/meta-data.
To understand which tools are responsible for what, let’s look closer at its product roster.
Tableau BI suite
The Tableau suite consists of products that basically allow you to connect to the source of the data, then fetch, format, visualize, share, and view it. So we’ll break out the main tools by the functions each can perform.
The main Tableau products and how you can use them to work with data
The whole suite is divided into two groups: managed tools for business users/data consumers, and self-service tools for data analysts/power users. While managed solutions make the process of presenting and consuming data faster, self-service tools allow for complete control, flexibility, and security.
A full spectre of Tableau BI products divided by managed and self-service ones
On the scheme above you can see the Tableau BI suite with green boxes depicting free managed tools. The logic of operating Tableau software works the following way.
A user retrieves data from the data sources and puts into an analytical interface (Tableau Desktop/Public).
Once the data is here, data preparation can be performed. Or if data is clean and ready for use, visualizations can be created on the fly.
Created visuals, dashboards, or data groups can be saved as workbooks, and further read via a Tableau Reader.
If there are other users that need to see the data, workbooks are pushed on one of three sharing servers and viewed either on PC or via Tableau Mobile app.
Now let’s take a closer look at each group of tools.
Data preparation and visualization
The core products you’ll be working with as the analyst (or power user) are actual visualization and data preparation tools.
Tableau Desktop is the main analytical tool that allows for connecting to the required data sources (file-based, servers, or databases), and transforming data into visualizations or dashboards. Tableau Desktop can integrate with multiple data sources, including SAP, Google Analytics, Amazon Web Services, and others.
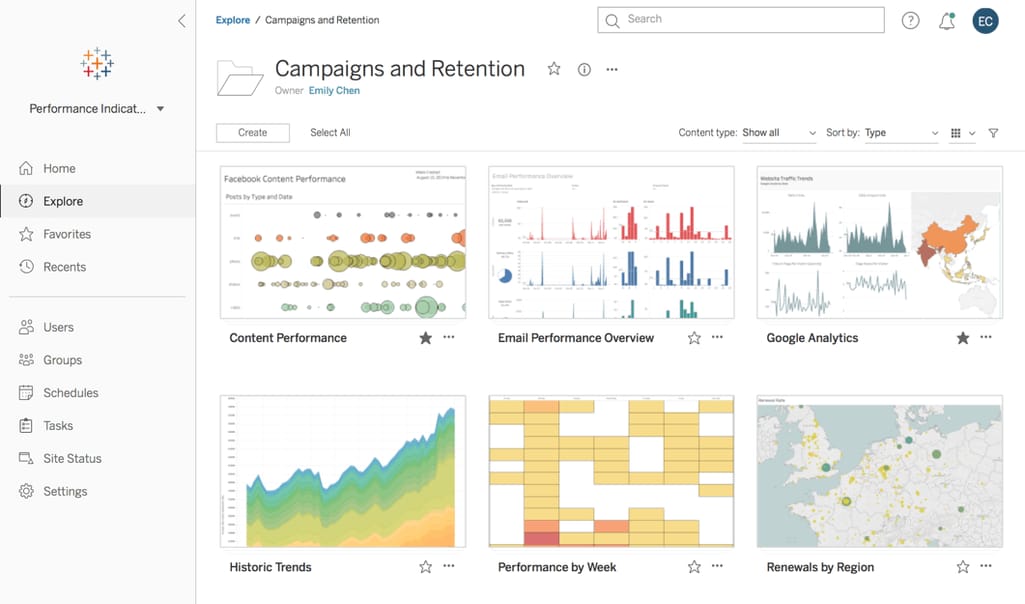
An example of data visualization in Tableau Desktop
Tableau Desktop is made for individual use on a single computer. The workbooks created with it can be shared and pushed onto a specific server for sharing data visualizations. So, the users with permission can access and modify the visualizations. Tableau Desktop is available by paid license, but a comparable level of functionality can be accessed via Tableau Public.
Tableau Public offers relatively similar functionality as compared to Tableau Desktop despite the fact it's a free alternative made for basic consumer purposes. Tableau Public suits researchers, journalists, or businesses willing to share any type of interactive data online. Comparable to other BI vendors and their free products, workbooks created in Tableau Public will be posted on the public server available for everyone to view. This means that you won’t be able to visualize sensitive corporate data with the Public distributive of Tableau.
Tableau Public travel data dashboard
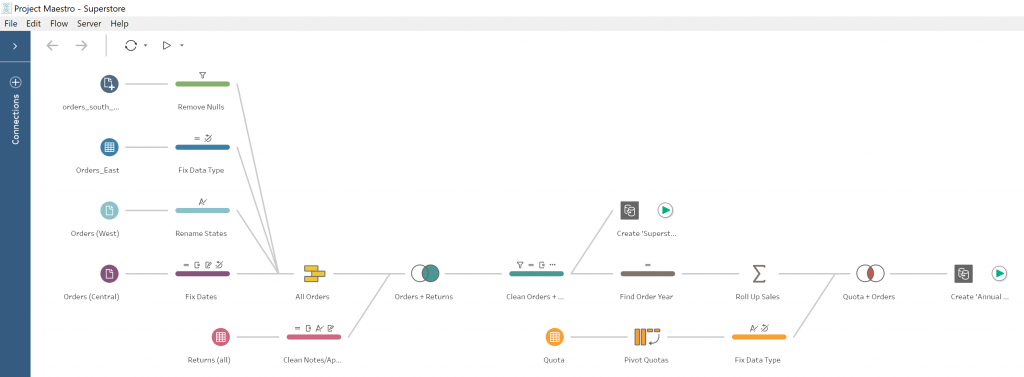
Tableau Prep is paired with Tableau Desktop. It’s a type of self-service ETL (Extract, Transform, Load) tool for quick data formatting and cleaning. It also has some data management functionality.
Tableau Prep is used to modify data before it is uploaded to Tableau Desktop or to modify already existing data. Preparation is aimed at making data digestible for the software format, so it can process it and create visualization with a valid output. Prep includes two instruments for different tasks.
Prep Builder is a preparation tool that lets you shift between different views by highlighting, for example, item index only or category data only. Such features make data combining and cleaning easier.
Prep Conductor basically allows you to manage data flow on the server, tweaking when and what data is uploaded to which users. Conductors can be utilized to supply users with the required data at the right time and provide permission-based structure of data consuming.
Connecting the data sources and regulating the data flow to the analytical interface can also be done via Tableau Prep.
Data access instruments
Creating the workbooks in the analytical tools is just a part of the whole process. If you only need to view the visuals or share them across different users, you need a specific tool to read the file format.
To get access to dashboards and visualizations, you can use the client application itself (Tableau Desktop, Public, or Mobile), or Tableau Reader to open the file format.
Tableau Reader comes as a type of viewer for presentations and visuals created via Tableau Desktop.
Tableau Mobile opens access to dashboards and visualizations via mobile devices. Mobile application is optimized for manipulating data using the sensor screen. While it doesn’t allow for connection to data sources via mobile and creating visuals there, it serves as a data access instrument.
Data sharing tools
The next step after working with your data and creating some visuals is sharing. Tableau offers several ways to share data across different users:
Tableau Server is a service for sharing visuals and dashboards created and published by means of Tableau Desktop. In simple terms, it’s a Google Drive deployed and managed on your own server. The access to it is shared within your organization members, so everyone can reach the data. Tableau server has built-in functionality to provide data access rules, permissions, and data flow configurations. However, this can be also done using Prep Conductor.
Tableau Online, similar to Tableau server, is a managed, cloud based sharing platform that connects to Tableau Public and Desktop. While Tableau Server is a more secure place to keep your workbooks, Tableau Online doesn’t require any hosting. So, you may choose between the two depending on your purpose.
Tableau Public Server is connected with Tableau Public. It is free to use and basically lets you share your visualizations and dashboards, but they will be accessible to anyone. Hence, it is called public.
As long as you use managed products or some basic functionality, you don’t need to be concerned about finetuning your data platform. When it comes to integrating BI tools in your business, you always have to consider what customization options are available.
Auxiliary tools
Tableau offers a bunch of options to adjust its products to your specific tasks or deeply manage processes inside servers and other data channels.
Tableau Developer Tools is the first instance of customization. Basically, it’s a set of APIs that allows you to connect with different data sources and integrate Tableau products into your existing software.
For example, Tableau can be enhanced by deploying MATLAB and reading statistical models from it. Or it can run Python code remotely by way of TabPy framework to create predictive algorithms. Such enhancements may be of interest to data scientists and analysts.
Embedded Analytics is another set of APIs that allows you to embed dashboards and reports into third-party applications, clients websites, and so on.
Server Management Add-on is a set of tools for maintaining and monitoring the server state. It includes instruments for server resource allocation, content migration, load optimizations, and metadata management.
Data Management Add-on is made for controlling data quality and flow within the Tableau platform. The add-on comes integrated into Prep Conductor and Tableau Catalog.
Tableau Catalog is a monitoring tool used to observe all the data available on your Tableau platform.
As you can see, the suite of instruments strongly supports different aspects of working with data. The central tool is Tableau Desktop that is extended with other tools for processing, sharing, or accessing reports and dashboards.
Tableau seems to be flexible in terms of customizing its products. With a huge number of available integration options, there is no vendor lock-in. All the tools in this category are dedicated to tech people. Customizing your tools and integrating the visuals into other applications requires programming knowledge, so you might consider hiring a BI developer.
Tableau compared with Power BI, Qlik, Thoughtspot, and Microstrategy
It's impossible to judge a tool on its own. The BI market rarely lets new players in, so the main battle is between market leaders, and Tableau is one of them. So let’s compare the closest competitors: Tableau, Power BI, Qlik, ThoughtSpot, and MicroStrategy considering the following criteria:
Pricing,
platform availability and deployment,
data sharing, and
source integration.
Let’s have a look at the main Tableau rivals on the market.
Power BI is an analytical cloud-platform by Microsoft hosted on Azure. As of 2020, it’s the industry leader, offering the broadest capabilities for storing, transforming, and analyzing data compared to other vendors.
Qlik is Tableau‘s main competitor due to their similar product lines. Known for its patented analytical engine and exceptional data processing speed, Qlik’s main focus is gathering analytics into dashboard. Tableau is more focused on separate visualizations.
ThoughtSpot targets enterprise-scale clients with its analytical platform for business data and big data analysis. ThoughtSpot’s unique feature is its AI-driven analytics providing automated reports and supporting data exploration.
MicroStrategy is another enterprise BI vendor focusing on cloud and mobile analytics for large businesses.
Now, let’s move to the comparison itself.
Pricing
For Tableau, Power BI, and Qlik, monthly subscription per user is the base pricing model. All three have freemium versions and multiple paid plans. ThoughtSpot and MicroStrategy don’t disclose their prices, so you may request them directly. Based on this information, we’ll break down the prices by regular use and enterprise plans per user.
Regular plans (user per month):
Tableau pricing starts at $12-15 for a viewer subscription and reaches $70 for a creator license that has all the functions available. Additional fees are added for using computation power or managed servers. Licensing for auxiliary tools is billed separately.
Power BI bills $9.99 per user license on a managed cloud platform plus compute costs.
Qlik charges $30 per user/month plus computation costs.
Enterprise plans:
Power BI enterprise pricing starts at $4,995 per a dedicated cloud (computation and resources are billed by quote).
Qlik Enterprise bills $70 per professional user (report creator) and $40 for analyzer (viewer) on a multi-cloud platform.
ThoughtSpot pricing offers Enterprise and Extended Enterprise plans with unlimited users by quote.
MicroStrategy pricing has no pricing plans or estimations. The price will also depend on resources used, so you can request estimates via their pricing page.
Platform availability and deployment
All five offer similar deployment options for dedicated products. Desktop products are tailored for individual use, while those deployed on the cloud or on a self-hosted server provide access for corporate users. As for platform availability, you can look at the table below.
Platform availability table of BI vendors
Tableau and Microstrategy have the widest coverage.
Data sharing
In terms of pricing plans, all 5 vendors have equal sharing products that allow for posting reports and dashboards on some sort of a server. The only difference is that MicroStrategy and ThoughtSpot do not support any type of public servers for free data exchange as they focus on the corporate segment of BI users.
Source integration
Data source integrations are established by API’s that come out of the box with all five vendors. They offer readymade connectors for popular sources like Amazon S3, Google Analytics, Jira, Github, etc. The lists of possible integrations are quite extensive, but we’re also interested in custom connectors. So, we’ll provide links for existing APIs and solutions for creating custom ones.
In terms of BI ecosystem and toolsets, there are many variations among all the vendors as they serve different purposes.
Choosing Tableau guarantees a wide functionality for visualizing various types of data and sharing it across users. With all possible extensions and modifications, Tableau suits businesses of all sizes.
In case your primary interest is in getting both data integration, analytics/visualization, and warehousing in one place, Power BI and Qlik are a better fit. Because of the wide range of BI services and ecosystem support, you won’t need to integrate third parties.
The third scenario is an enterprise looking for a readymade data platform with strong support of advanced analytics, machine learning capabilities, and constant maintenance. In this case, you might be looking either at Power BI, as it can support resource-demanding systems, MicroStrategy, or ThoughtSpot.