In the fast-paced world of software development, the journey from idea to code to customer is critical. Teams strive for fast and efficient performance – but what is fast and efficient? How can we understand how well we perform and, most importantly, whether we are getting better with time?
DORA metrics are sometimes seen as the magic compass that is expected to guide DevOps teams toward peak performance. But is this really so? In this post, we’ll dive into the what, why, and how of DORA metrics and offer you some practical recommendations on how to approach them.
For those of our readers who are new to DevOps, we’ll first provide a brief recap on this concept. If you’re a seasoned professional, feel free to skip the next section.


What is DevOps?
DevOps is a combination of practices and tools designed to increase an organization's ability to deliver applications and services at high velocity. It blends the development (Dev) team, which writes and tests software, with the operations (Ops) team, which manages the infrastructure and releases the software.
DevOps encourages continuous software development, testing, integration, deployment, and monitoring. By automating and streamlining the development lifecycle, DevOps helps produce software products rapidly and improve them faster than using traditional software development and infrastructure management processes.
Since DevOps emphasizes continuous assessment and improvement, measurement is a crucial element of this approach. Metrics monitoring provides the data that helps teams enhance software development processes.
We have a separate post about the top 10 DevOps metrics to evaluate team performance and workflow efficiency. But the most well-known among them are the so-called DORA metrics.
What are DORA metrics and why are they important?
DORA metrics are a set of KPIs that measure the effectiveness of software development and delivery teams. They were developed by DevOps Research and Assessment (DORA) – a program run by Google Cloud – and are used in the DevOps community to assess and improve practices. Here are the DORA metrics and what they measure.
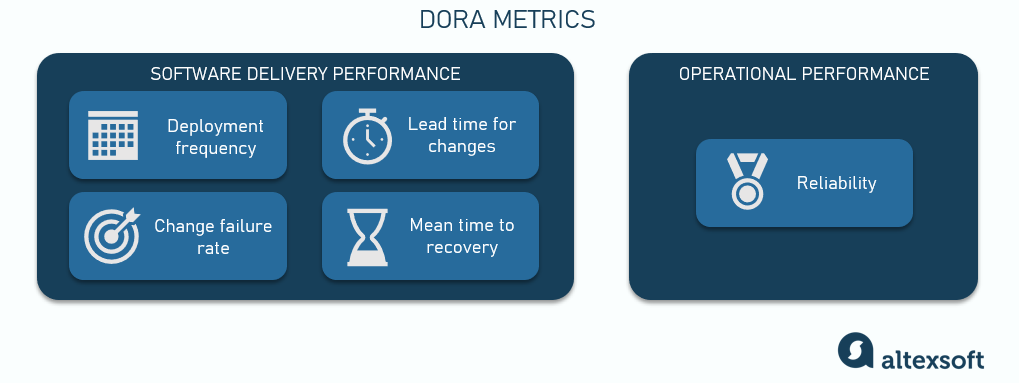
Deployment Frequency (DF) – How often an organization successfully releases to production.
Lead Time for Changes (LTC) – How long it takes for code to get into production.
Change Failure Rate (CFR) – How many deployments fail.
Mean Time to Recovery (MTTR) – How quickly an organization can recover from a failure in production.
Initially, there were four metrics, but in 2021, one more was added to the framework.
Reliability – The team’s overall ability to meet expectations and fulfill objectives.
Reliability is the compound assessment of operational performance rather than a quantifiable metric. Today, some sources and companies include reliability in the DORA set of metrics, but most still stick to the initial four. Since the DORA team itself doesn’t provide any formula or benchmarks for the newcomer, we won’t go into much detail.
Each of the DORA metrics provides insight into different aspects of software delivery and team performance. The first two metrics reflect the throughput or operational velocity, while the other three assess stability.
In the next few sections, we’ll describe the DORA metrics in depth, but, first, let’s explain why we should care about them at all.
Performance measurement. DevOps performance can be challenging to measure, especially for large, complex projects. DORA metrics provide visibility into different aspects of the software development and deployment process. This allows teams to measure their productivity in quantifiable values and establish benchmarks. By consistently tracking these metrics, teams can see how their changes affect performance over time, providing a clear view of progress or regression.
Continuous improvement. The core philosophy of DevOps revolves around continuous improvement. DORA metrics provide data that can guide teams in fine-tuning processes and, ultimately, increase productivity.
Risk management. DORA metrics such as Change Failure Rate and Time to Recovery directly relate to the risk management aspects of software deployment. Companies can manage risk more effectively by understanding and improving these metrics, thereby reducing downtime and the impact of deployment failures on end-users.
Cultural change. By focusing on metrics, organizations can shift the culture from one that might blame individuals for failures to one that objectively assesses processes and outcomes. This leads to a more constructive approach to problem-solving and promotes a culture of accountability and transparency.
Besides, the shared focus on improving these metrics can foster better cross-team collaboration, which is essential for successful DevOps practices.
Now, let’s discuss each of the metrics one by one and explore how we can track, interpret, and improve them.
Deployment Frequency (DF)
Deployment frequency (DF) shows the number of successful deploys over a period of time. This metric is a key indicator of a team's productivity – or ability to execute and deliver value to customers.

Deployment frequency 2023 benchmarks
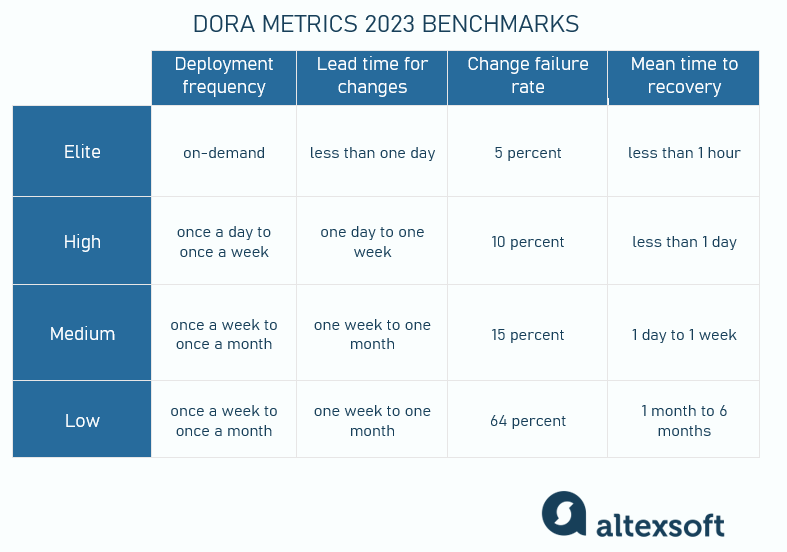
Elite performers – on-demand (many deploys per day).
High performers – once a day to once a week.
Medium and low performers – once a week to once a month.
How to interpret deployment frequency?
A high DF is typically a sign of a mature DevOps process because it suggests that the team can quickly and reliably deliver changes. If your DF decreases over time, it might be a sign of bottlenecks or other workflow inefficiencies.
The ideal frequency varies by organization and project, but moving towards more frequent deployments is often seen as a positive indicator of Agile practices. Also, a consistent or gradually growing DF supports the planning process by helping schedule releases.
How to track deployment frequency?
Use CI/CD tools like Jenkins, CircleCI, or GitLab CI to automate deployments. These instruments log every deployment event, making it easier to measure frequency.
Also, integrating your CI/CD pipeline with version control systems like Git will allow for the automatic triggering of deployments whenever new commits are made to the main branch.
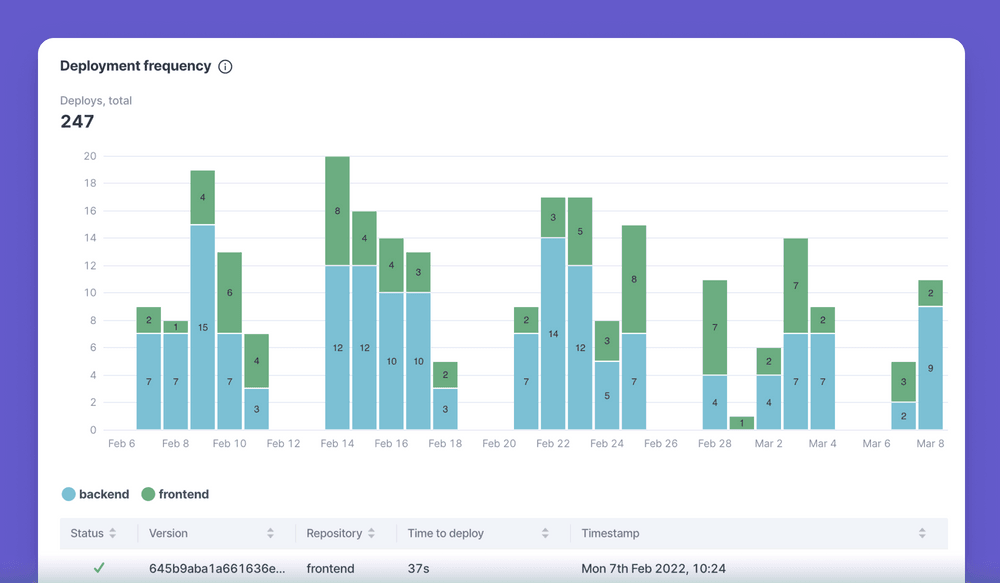
Dashboard tools such as Grafana, Datadog, or custom dashboards built into your CI/CD platforms can visualize deployment frequency trends over time – among other metrics.
How to improve deployment frequency?
When increasing DF, the key thing to keep in mind is that it shouldn’t impact quality. Always remember to balance velocity and value delivered.
To improve DF, consider breaking down large chunks of work into smaller batches. Not only will such granularity increase DF, it will also allow you to get feedback faster and promptly address possible issues.
Also, scrutinize your workflows to define and eliminate bottlenecks. It might be an inefficient process (e.g., code review is a common impediment) or a technical issue (e.g., poor integration).
Automation, which lies at the very core of DevOps, is another way of speeding up your development pipeline, so automate as much as you possibly can.
Pro tip
DF traditionally accounts only for successful deployments. However, you can also track the overall number of deployments, even those that resulted in outages, hotfixes, rollbacks, or service interruptions. This way, you’ll get a broader picture of your performance.
Lead Time for Changes (LTC)
Lead time for changes (LTC), also called Mean lead time for changes (MLTC) or Change lead time, measures the amount of time it takes for a change (like a new feature or a bug fix) to go from code commit to successfully running in production.
Just like deployment frequency, LTC helps assess operational velocity. These two metrics are interrelated, i.e., the more often you deploy, the shorter your change lead time is.

LTC 2023 benchmarks
Elite performers – less than one day.
High performers – one day to one week.
Medium and low performers – one week to one month.
How to interpret LTC?
A shorter lead time suggests that the development and deployment pipeline is efficient and well-optimized. It also indicates that a team is more agile and can respond faster to market or customer needs.
Optimally, organizations strive to reduce the LTC as much as possible without compromising quality or stability. Also, consistent lead times help build more predictable release schedules, which is crucial for planning and alignment with business objectives.
How to track LTC?
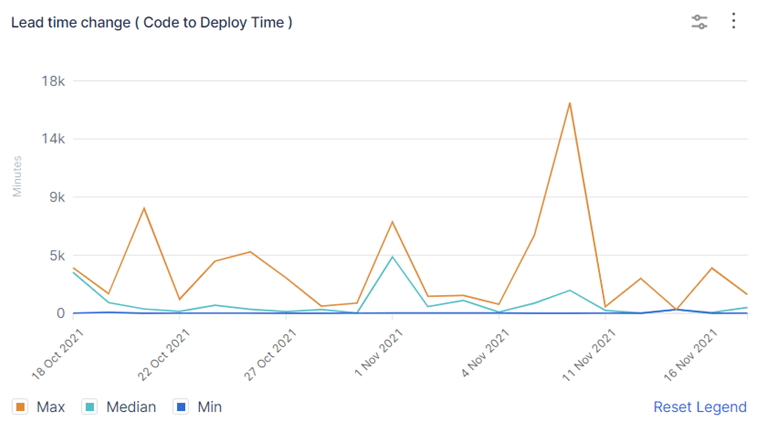
To accurately measure lead time, track how long it takes for a certain change to reach production from the moment code is committed. Many CI/CD tools offer plugins that automatically calculate LTC and provide insights into delays or inefficiencies.
Alternatively, you can develop custom scripts to extract timestamps from code repositories and deployment logs to calculate lead times.
Also, you can link commits to issues in tracking systems like Jira or Asana to measure the time from issue creation to deployment.
How to improve LTC?
Since LTC is so tightly interconnected with deployment frequency, the tips here are very similar. Basically, it’s all about efficiency, so to reduce lead times, identify and remove any bottlenecks in your CI/CD pipeline that slow you down. This could involve optimizing test suites, improving build speeds, or simplifying approval processes.
Also, automate your workflows to make processes faster. And, of course, remember about the speed/quality balance.
Pro tip
To have more granular data to analyze, you can break down your processes further and look at the duration of each piece separately. This will give you insights into the productivity of distinct workflows and team members.
Change Failure Rate (CFR)
Change failure rate (CFR) measures the percentage of deployments that cause a failure in production, such as service outage or degraded performance, or otherwise require immediate remedy. CFR shows how effectively the team implements changes.

CFR 2023 benchmarks
Elite performers – 5 percent.
High performers – 10 percent.
Medium performers – 15 percent.
Low performers – 64 percent.
How to interpret CFR
Lower change failure rates are better as they indicate higher reliability of the deployment processes and overall system stability. Low CFR might also reflect more robust testing and QA practices.
In contrast, a high CFR is usually a sign of inefficient processes. It’s also important to pay attention to CFR while planning, as high rates would likely mean longer fix cycles, which can ultimately impact the release or product launch schedules.
Ideally, teams aim to minimize the CFR to ensure that new releases improve the user experience without introducing instability or bugs.
How to track CFR
Consistent criteria are essential for accurate measurement. Clearly define what constitutes a deployment failure (e.g., service downtime, rollback, hotfixes required).
Use the logging and monitoring tools we mentioned earlier to track the success or failure of each deployment. Integration of these tools with your deployment process ensures accurate data collection.
Establish feedback loops in your deployment pipeline. Tools like Spinnaker can provide automated canary analysis, which helps reduce the likelihood of promoting faulty changes to production.
How to improve CFR
Improving change failure rate means delivering more high-quality, error-free code – and that’s all about enhancing QA processes. So assess your code review and testing workflows to see how you can optimize them and ensure top quality.
The aforementioned 2023 State of DevOps Report concludes that loosely coupled architecture, continuous integration, and efficient code reviews are the factors that have the biggest impact on performance and operational outcomes. So be sure to pay attention to these elements.
Pro tip
Try to investigate the root causes of change failures. Regularly review QA and testing reports to identify failed deployments, link them to the changes that caused them, and think hard about the reasons for the incident. Those can include deployment errors, insufficient testing, poor test coverage, low code quality, rushed deployments, etc. Once you identify the reason, you can address the initial issue.


Mean Time to Recovery (MTTR) or Failed Deployment Recovery Time (FDRT)
Mean time to recovery (MTTR), also known as Time to restore service (TRS) or, as DORA recently updated, Failed deployment recovery time (FDRT) tracks the time it takes to restore service after a deployment failure that results in service disruption, e.g., an outage.

FDRT 2023 benchmarks
Elite performers – less than 1 hour.
High performers – less than 1 day.
Medium performers – 1 day to 1 week.
Low performers – 1 month to 6 months.
How to interpret FDRT
This metric is critical for understanding the resilience of your operations. A shorter recovery time shows that a team is effective at identifying and addressing issues quickly, minimizing downtime.
In other words, the faster a team can restore service, the less impact there will be on end-users, which is crucial for maintaining trust and satisfaction.
How to track FDRT
Implement incident management tools like PagerDuty, Opsgenie, or ServiceNow for real-time monitoring. They can help log the start and end times of an incident, crucial for measuring FDRT.
How to improve FDRT
To reduce recovery time, review your response workflows and incident management practices to detect and eliminate any inefficiencies. Use CI/CD tools to automate your rollback and recovery actions.
Also, consider using comprehensive monitoring tools like New Relic, Datadog, or CloudMonix to detect and alert on system anomalies quickly.
Another way to reduce response time is deploying changes in smaller batches. It will allow you to find and address the issue faster.
Pro tip
Hold postmortem meetings and create reports regularly to gather data and insights on incident durations. This will help you better understand the incident's root causes, trends, and improvement opportunities.
Now that you know what the DORA metrics are, let’s determine whether you need them at all.
Should we track DORA metrics: key factors to consider
As Glib Zhebrakov, Head of Center of Engineering Excellence at AltexSoft, shared: “Despite all the fuss around DORA, not all teams will benefit from their adoption.” Glib suggested several key factors to consider when deciding on implementing the new measurements.
(Please note that all projects and companies are different and we can’t discuss every single scenario, so we’ll only look at the most common ones.)
Company size, structure, and maturity. For smaller companies and startups, DORA metrics will most likely present unnecessary process complications. On the other hand, if you run a huge, multi-project enterprise with multiple distributed teams, it might be too difficult to collect all the data accurately.
Project size, duration, and complexity. If you work on a short-term project (e.g., less than a year) or have a simple, sprint-based release schedule (e.g., one release per sprint), you probably don’t need DORA metrics. Conversely, long-term projects with multiple, regular releases can benefit from tracking these metrics.
Current challenges. Evaluate areas where your team faces challenges. If issues like missed deadlines or high failure rates in deployments are common, DORA metrics can help identify and address these problems. However, if your main challenges are, say, developer burnout or lack of skilled professionals, you probably need some other initiatives.
Staff. Additional processes demand additional labor resources. Who will collect data, analyze it, and suggest improvements? Do you have experienced personnel or will you need to hire dedicated experts? Evaluate if you have the capacity to manage this.
Technology and integrations. Consider whether you already have the tooling to support tracking DORA metrics or whether you would need to invest in new platforms. Also, assess how easily new metrics can be integrated into your current CI/CD pipelines and whether they align with your existing KPIs.
So basically, just like with any other initiative, you have to compare the related costs and benefits. Analyze the potential return on investment of implementing these metrics against the resources and effort required.
Further actions. Also, an important question to ask yourself is what you’re going to do after you get the measurements. What actions will you take if the results are positive – or negative? In many cases, project managers are already aware of the existing issues – so is it worth proving something you already know instead of focusing on improvements?
If, after all these considerations, you decide that you want to give DORA metrics a try, here are a few tips to help you do things right.
Adopting DORA metrics: challenges and best practices
To make the most out of the DORA metrics, organizations need to establish a solid foundation with the right tools, processes, and practices. However, their implementation comes with its own set of challenges that are worth knowing about.
We’ll discuss some of the common hurdles organizations face when adopting DORA metrics and suggest some ideas on how to address them.
Lack of stakeholder buy-in
Fostering a culture that values measurement, transparency, and continuous improvement is part of implementing DevOps, but it’s easier said than done. Often, investors, C-level management, or other decision-makers don’t understand the point of these metrics because they don’t see how they translate to business outcomes. And that’s partially true since the team’s productivity doesn’t necessarily guarantee business success.
Besides, changes in measurement can also be met with resistance from the development teams as they can be seen as additional overhead or scrutiny.
Solution: Explain to decision-makers how operational performance impacts business objectives. Despite the lack of guarantees, higher-quality code usually leads to better working systems and, in turn, to more satisfied customers.
On the other hand, communicate the benefits of measuring and improving productivity with the dev teams. Stress the importance of using DORA metrics not just as a measure but as a basis for continuous learning and adaptation.
Inefficient data collection
Gathering accurate data for DORA metrics requires integration across various tools (e.g., version control, CI/CD pipelines, monitoring systems, and incident response tools). Disparate systems and lack of automation can complicate this process.
Solution: Consider tools like Jenkins, Spinnaker, or GitLab to automate the processes of collection and reporting of metrics and reduce errors. Ensure that all tools used in the software development lifecycle are integrated so that data flows seamlessly from one to another.
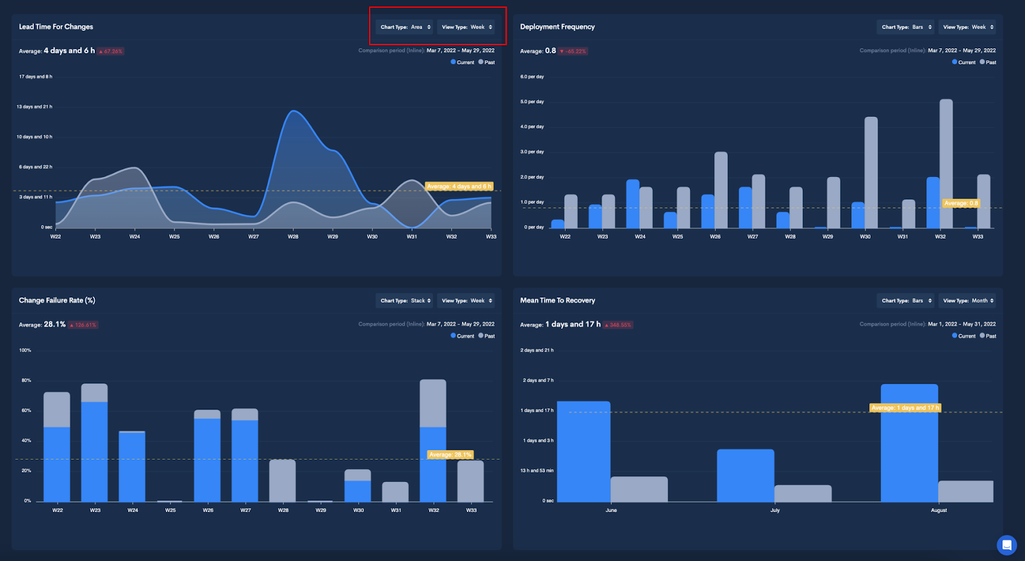
Also, to get the necessary granularity and reliability for DORA metrics, consider implementing specialized monitoring solutions like the ones we mentioned throughout this post. You can also go with value stream management platforms or software engineering intelligence tools like Codefresh, Plandek, Code Climate, etc.
Misinterpreting or misusing metrics
There's a risk that teams might try to game the metrics or misinterpret what they represent, leading to decisions that don't actually improve performance.
Another common mistake is overreliance on DORA metrics and using them out of context. It can lead to a narrowed focus, potentially missing out on other crucial aspects of software development and team dynamics.
Solution: Provide thorough training on what each metric means and how it should be used. Employ dashboards to visualize these metrics in real time, helping teams understand the current state and trends.
Ensure you don’t make metrics your sole target but rather support your business objectives. And don’t take them too literally. Context is crucial when interpreting these metrics. For example, it’s not a good practice to compare results across teams or projects because the baseline will be different (e.g., it’s normal if web developers deploy more often than mobile engineers). It’s better to monitor their dynamics over time for every team separately.
Also, as we mentioned earlier, the metrics themselves can only signal performance issues, but they can’t tell you what exactly is wrong. So it’s important to delve into the root causes behind unsatisfactory measurements to understand what contributed to such results.
For example, you might see a decline in deployment frequency, but it might be because of the vacation season and part of the team is absent. Or maybe it’s because the team was working on a big, new feature that had to be released as a single piece.
Remember to use the DORA metrics together to balance development speed and quality – and don’t neglect other measurements. Combine them with Agile KPIs, individual developer metrics, and/or other frameworks like SPACE (Satisfaction, Performance, Activity, Collaboration, Efficiency) to get a more holistic view of the state of affairs.
How to start with DORA metrics: final tips
So now that you’re fully equipped to calculate, track, and interpret the DORA metrics, here are some final practical recommendations for you to start implementing them.
Ensure buy-in from stakeholders. Align these metrics with broader business objectives to ensure that improvements contribute to the overall success of the company. To demonstrate value, communicate the impact of DORA metrics on improvement initiatives to stakeholders.
Be flexible. As we said, smaller organizations might find the overhead of tracking these metrics daunting, whereas larger organizations might struggle to implement them consistently across teams. So tailor DORA adaptation to your own situation.
If you are a smaller organization, start smaller with key projects. For larger companies, work on developing centralized, cross-system visibility. Consider tools like Tableau, Power BI, or other BI solutions to create centralized dashboards that display real-time and historical data on DORA metrics.
Provide training and work on the culture. Educate your team on what these metrics mean and why they are important. Foster a culture that values continuous improvement and data-driven decision-making.
Iterate and refine. Start measuring with basic setups and iterate as you refine your processes and tool integrations. This approach reduces overwhelm and allows for gradual improvements.
Set up regular intervals (e.g., weekly, monthly) to review these metrics and track trends over time. Experiment with changes to your processes and monitor how these changes affect your DORA metrics.
Collect feedback and collaborate with the teams. Implement feedback loops where insights from the metrics guide development practices and operational decisions. Encourage teams to discuss these metrics in retrospectives and planning meetings to identify what can be improved.
Set baselines and improvement goals. As you collect measurements, establish baselines for each metric based on historical data. Set specific, realistic improvement goals for each metric to guide your team's efforts and track progress.
Implementing DORA metrics can enhance your ability to deliver software efficiently and with higher quality. By following these practical recommendations, you can obtain better visibility into their DevOps processes and drive meaningful improvements.
