

Back in 2010, Amazon migrated its servers to the AWS cloud and launched the Apollo code deployment platform. It allowed developers to deploy code whenever they needed to any of the Amazon servers. So, they also put operations staff to work closer with developers and ensure stable deployment. This allowed the Amazon team to deploy new code every 11.7 seconds, with more than a thousand deploys a day.
What Amazon became was a defining factor for DevOps, a set of software development and IT operations practices. It aims at delivering a more reliable software fast by means of automation and collaboration between development and operations. The principles of DevOps became widely adopted, as it closely relates to the well-known Agile and basically serves as its extension.
DevOps at its core relies on automation as a major approach to testing, deployment, infrastructure configuration, and other tasks. Understanding tooling will help you set up the process for the DevOps team in the right way. In this article, we’ll discuss the categories of tools existing for DevOps and look at instruments for continuous delivery/integration, testing, monitoring, collaboration, code management, and more. If you know the basics, feel free to skip the first section and jump right into the DevOps tools section.
Learn about the role of a DevOps engineer in our dedicated article.
What is DevOps: processes and practices
If you’re not familiar with the peculiarities of DevOps and the practices used in it, we recommend you read this section first.
DevOps is the practice of uniting developers (nearly any person taking part in development: engineers, testers, product designers) and operations (sysadmins, DBAs, security engineers, etc.). This is an important cultural aspect that implies removing silos in communication between team members to achieve transparency and clarity regarding what everyone’s doing.

DevOps in a nutshell
Practices like testing automation, continuous delivery, and deployment encourage shorter development cycles and help DevOps teams make constant releases. This means that smaller chunks of the code are developed and deployed in production. The general idea can be explained with the CAMS acronym:
- Culture of collaboration and shared responsibilities between the team members,
- Automation of the manual processes,
- Monitoring and feedback gathering, and
- Sharing of responsibilities and information.
These principles form the general idea of how a DevOps development lifecycle may look.
DevOps development cycle explained. Source: www.atlassian.com
As any Agile project, DevOps by default includes classic steps such as planning and designing, coding, testing, deploying, and monitoring. But there are differences in how these steps are approached, so we’ll break it into the specifics here:
Collaboration and planning. The way a product team is formed and communicates is one of the key points in DevOps. A team where devs and ops, testers, and designers are merged is called cross-functional. The members of this team are supposed to collaborate more closely, share responsibilities, and get involved at each stage of the product development.
Server configuration and infrastructure as code. Cloud services like Azure and AWS became a standard way for DevOps projects to set the infrastructure. The infrastructure as a code is a concept of managing servers in the cloud, using configuration files, instead of dealing with manual configurations. As soon as you provide server settings in a code, the settings can be copied and applied to multiple servers as well as be changed quicker.
Continuous integration (CI) comprises various processes that prepare code for deployment in DevOps. They can be logically divided into build and test automation. Build entails downloading source code and files from a central repository, compiling them, and preparing code for deployment. Automated tests run once an engineer commits their code to the repository. CI is meant to create an automated pipeline that will ship deployment-ready code.
Continuous delivery (CD). Following the CI stage, the code can be deployed by developers and operations to production. In contrast with Agile projects, we deploy every production ready bit of code, so the cycle of development is smaller, deploys are more frequent, and bugs are easier to spot and fix.
Continuous deployment (also CD) as well as continuous delivery is the process of constant delivery of software to the customer. The difference is, in continuous delivery, developers will make a final decision on when they need to deploy the code. While in continuous deployment, pipelines deploy code automatically and constantly.
Containerization and orchestration. Containers provide separate bits of code with all the environment elements, like libraries and files. This enables every piece of software deployed in a container to function across different operating systems. In a microservice architecture, dozens of containers will be interconnected making up the app. So, we also need to configure and manage them and that is called orchestration.
Monitoring and alerting. Application performance becomes a bit harder when we constantly add new features. DevOps facilitates a high culture of observability, which brings us to a range of tools and methods to application monitoring via a dedicated interface.
If you want to learn more about monitoring system and team perfrformance in DevOps, check our dedicated posts about the top 10 DevOps metrics and the 4 DORA metrics.
Security and DevSecOps. This is a dedicated discipline that concerns the security of a DevOps infrastructure.
Whether your part of a team or an executive looking for implementing DevOps in your organization, the following list of tools will be helpful. We’ll split the tools by the spheres of activity in DevOps and try to analyze what’s available and what is a better choice.
Short disclaimer: we're not attempting to describe every tool available. These are descriptions of a general flow, with major tools as examples.
DevOps collaboration and planning
Trello, Jira, and Slack are obvious options here. If you’re a part of a product team, there is a high chance you already use these tools and know about them. If you're willing to look at something new, here are three apps that are suitable for a DevOps team and overall infrastructure.
These apps represent project management tools stuffed with all the standard features for task management, time tracking, planning, invoicing, chatting, etc. We’ll do a brief overview of the specific features and available integrations.
Clarizen
Clarizen is a software-as-a-service (SaaS) project management tool. Among useful features, task descriptions may include CAD drawings in design/project view modes. Also check their third-party integration list to make sure that your toolset matches up with it well.
Asana
Asana is another SaaS product management tool that has a useful division of the interface by workflows, so you can organize the tasks precisely depending on your flow. Here’s the third-party integrations list.
Bitbucket Server
Bitbucket Server enables teams to use GIT as their version control and collaborate inside GIT projects. So, it combines features of code management interface and project management application in one. Bitbucket is an Atlassian product, so it can integrate with all its ecosystem, including Jira.
Server configuration and infrastructure as code management
As we mentioned before, usually DevOps projects deal with cloud infrastructure. The most prominent cloud infrastructure providers are
The capacity of such infrastructure is allocated dynamically, depending on the needs of the application. Manual process of server configuration is slow, complex, and prone to errors. This contradicts the idea of DevOps, where we need to change configurations of a system rapidly, without downtimes.
So, for this purpose, configuration management tools are used. A configuration manager is a centralized point of control for infrastructure settings that can be applied once for multiple servers. Or configuration change can be automated. Let’s have a look at the configuration management tools.
Puppet
Puppet. Configuration management by Puppet is one of the best known tools to finetune servers in DevOps. It uses Domain Specific Language (DSL), so configurations are written in declarative language. Basically, it means that we specify the desired resource state, rather than specifying how to achieve it. IT staff is often handier with declarative methods, as these are the same for XML or JSON.
Puppet is capable of automating configuration, but there are a lot of third party modules that can be installed to do this procedure. It can also be used for automated deployment with the help of Continuous Delivery workflows. Visit the pricing page for information.
Chef
Chef. Chef is also a highly recognizable configuration management system. The main difference between Chef and Puppet is that Chef runs an imperative language to write commands for the server. Imperative means that we prescribe how to achieve a desired resource state, rather than specifying the desired state. That said, Chef is considered to be suitable for the teams dominated by developers, as they are more familiar with imperative languages, like Ruby.
Chef for DevOps covers the work with various services including containers (Kubernetes) and integrates with Azure platform. It also features a DevSecOps system to automate security processes. Visit the pricing page for options.
Ansible Red Hat
Ansible Red Hat. Any configuration management tool requires installing an agent software. These are small programs that work as a medium between a master program (interface of a configurator), and pass the commands to the dedicated servers. Ansible is capable of controlling the infrastructure without agent software, requiring only SSH keys to start managing the system.
The SSH key is a shell that secures connection with a virtual entity (server), so Ansible utilizes a more simplistic but still secure way to operate the infrastructure. It also uses a declarative language to specify the desired state. Ansible offers a free trial.
As all the tools mentioned above, Ansible is open source and has a range of tools for DevOps, namely container orchestration, continuous delivery system, and security automation.
SaltStack
SaltStack is extremely similar to Ansible, as it uses the same SSH keys. SaltStack is written in Python and supports YAML templates to create scripts for configuration automation. Moreover, it integrates with the Red Hat platform.
The open source version of SaltStack is free to use. The enterprise tool that allows for automating the orchestration is paid, so check the corresponding page.
AWS Cloudformation
AWS CloudFormation. This is a service for managing infrastructure as code. It suggests using YAML or JSON as a declarative language to input configurations through Amazon S3 as an object storage. S3 passes the given configurations to AWS CloudFormation to form a stack of a sample code that further sends configurations to the server.
All of the mentioned tools calculate pricing depending on the computation resources involved. So, inquire to get the pricing. Amazon provides CloudFormation resources for free, but there are instances when the price will be calculated differently. The pricing page is here.
To sum up, Ansible and SaltStack seem to be the most lightweight and accessible options. Others differ by the method of configuration, so you may consider the choice between imperative and declarative languages.
Continuous integration and continuous delivery/deployment
Continuous integration and delivery/deployment (CI/CD) is performed via a single pipeline with high automation at every stage of the process. However, there are dedicated tools to automate build and test stages to prepare code for deployment. In this section, we’ll describe both types and divide them by purpose.
Jenkins
Jenkins is an all-purpose, open-source automation tool for CI/CD stages that can also be used as a CI server. Jenkins is self-contained in Java and supplied by libraries and files of OSs like Mac, Windows, and other Unix-based ones. Which means it can run in any environment without additional containerization.
While it’s often seen as only a continuous integration tool, Jenkins offers various plugins to automate the whole process.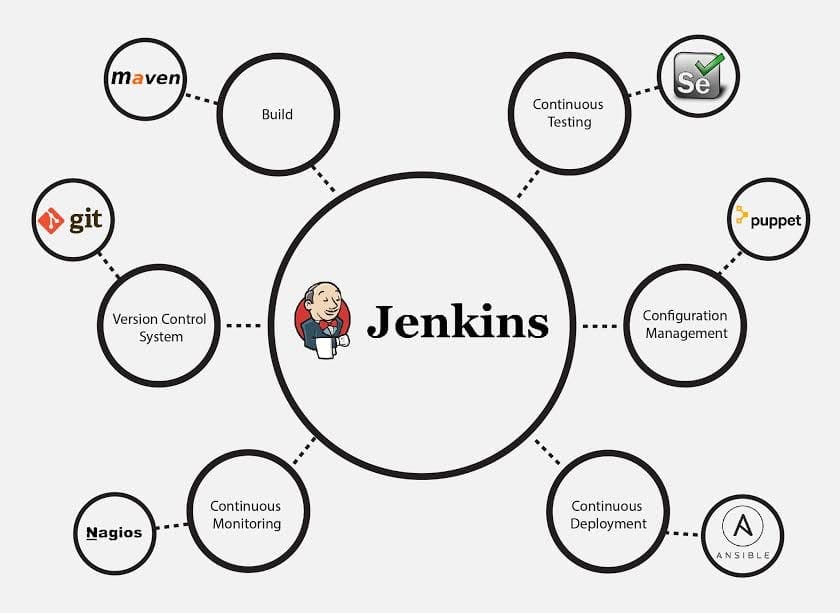
Jenkins plugins covering the whole CIDC automation cycle. Source: edureka.co
Considering the plugins mentioned on the diagram, let’s break a typical flow of a continuous integration with Jenkins.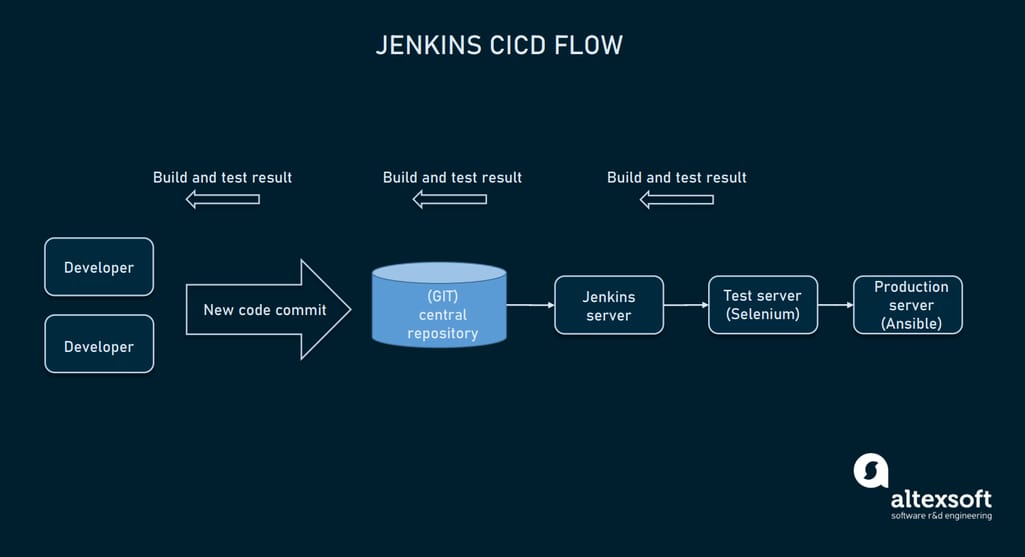
Jenkins CI/CD flow with GIT, Selenium, and Ansible plugins
- Developer commits the code to the source code repository (GIT). Jenkins checks the changes made.
- Jenkins recognizes the commits and pulls them to create a new build on its server.
- If the build fails, a developer receives notification.
- If the build is successful, Jenkins deploys it on a test server.
- Selenium testing tool is running automated tests. When the tests are finished, Jenkins sends test results to developers.
- The successful build is deployed to the production server via Ansible.
- Jenkins continues to check the source code repository for new changes.
The whole infrastructure is configured with the help of the Puppet configuration management tool. This is an example of a typical flow, which can be similar for other CI/CD tools of the whole cycle.
Gradle
Gradle offers similar capabilities to Jenkins. Developers can use С++, Python, or Java to write code. The builds are created via a Domain Specific Language.
Concerning the plugins, they are all searched via GIT. You can find all the plugins mentioned above (Selenium, Puppet, GIT, Ansible) for Gradle as well. Custom plugins can be added to extend the core functionality.
GitLab CI
GitLab CI is a free and open-source continuous integration, delivery, and deployment tool from GitLab. The system uses Herokuish buildpacks to determine the programming language and seamlessly integrates with GIT repository. Integration with other tools is also available via plugins, e.g., it’s natively integrated with Kubernetes containers. Prometheus is integrated as a monitoring tool to keep track of code performance on the production.
Travis CI
Travis CI. It’s a SaaS CI/CD tool that uses YAML to create the automation pipelines and has native integration with GIT tools. The deployment part is done with the help of Kubernetes and Helm Chart. By the link you can find configurations made for Travis CI. Among its great features, it can run parallel testing, and makes automatic backups of a previous build before a new one is created.
As it is cloud hosted, Travis CI doesn’t need any server, but there is an enterprise version configured for on premise implementation. Also deploying the open-source code is free in Travis CI.
Bamboo CI
Bamboo CI is an Atlassian CICD tool that works similar to Jenkins and is considered its biggest rival. Seamless integration with all the Atlassian tools goes by default: built-in Jira and Bitbucket, GIT branching, parallel testing, and execution. For customization purposes, there is a dedicated REST API with 200+ plugins available in an Atlassian marketplace.
The Bamboo CI system's only downfall is a limitation in hosting. While most providers offer both cloud and on-premise hosting, Bamboo CI is recently available for on-premise hosting only.
Teamcity
TeamCity is a CI product by JetBrains written in Java. The pipeline uses declarative methods, as the scripts are written in Kotlin DSL. It also uses an agent-based system to create builds. But while servers can use one operating system, the agents can run on different OSs.
The product is distributed under commercial license; the price starts at $299 per year. The list of integrations includes over 338 positions.
There are many other CI/CD tools out there, so we have to make some honorable mentions here as well. If, for some reason, major tools don't fit your needs, check also GitHub workflows, Circle CI, and Azure.
Containerization and orchestration
As we’ve mentioned previously, containers are immensely popular in DevOps to ensure that every bit of code can function in any environment.
Orchestrators are the tools used to monitor and configure all the existing containers put on product or that are in the staging area. Most often they come built into CI/CD pipelines as default tools or can be plugged in as extensions.
Docker
Docker is widely known for containers, as it’s the most popular tool to build them. Containers use shared operating system resources, allowing the code to function in any environment, removing the workload from developers. It uses Dockerfile and Docker Compose to create and configure containers.
Containers built with Docker are often orchestrated by Kubernetes and both platforms appear to be highly usable with each other.
Kubernetes
Kubernetes. This is an open-source container-orchestration platform. It uses declarative programming language and automation to set up the containerization for the DevOps infrastructure. Most of the configuration and CI/CD tools integrate with Kubernetes out of the box.
Containers ensure the lightweight system for microservices, keeping each component encapsulated and easy to orchestrate. The orchestration feature in Kubernetes allows you to manage the clusters of nodes (that bear one or more containers inside) and its workload with the help of controller manager, front-end API, and scheduler instruments. These are the tools that perform resource allocation, configuration, scheduling, container availability, traffic balancing, and more.
OpenShift
OpenShift is an open-source SaaS container platform. It's built on a Kubernetes engine and RedHat enterprise Linux platform. It also includes instruments for orchestration. OpenShift offers a self-service SaaS platform (OpenShift Online), as well as a managed one (OpenShift Dedicated).
RedHat offers a big range of services we have mentioned previously. Considering that OpenShift uses the Kubernetes engine, it seems like a good alternative for the project with open-source code. It can also be implemented on the on-premise servers.
Monitoring and alerting
As the build passes all the tests successfully, automated CI/CD systems can deploy them on the production server. This is the final stage where DevOps teams receive feedback and monitor overall system health. Following general DevOps practices, monitoring is also automated and done continuously. In this section, we will pick a few monitoring and alerting tools to look at.
Prometheus
Prometheus is a popular open-source monitoring and alerting tool that originated with SoundCloud. It’s well-built for microservice architecture supporting multi-dimensional data collection. The software package includes a Prometheus server (where the monitoring is held), user libraries for code instrumentation, and a dedicated Alertmanager. The metrics can be queried and visualized via a dedicated interface, Grafana.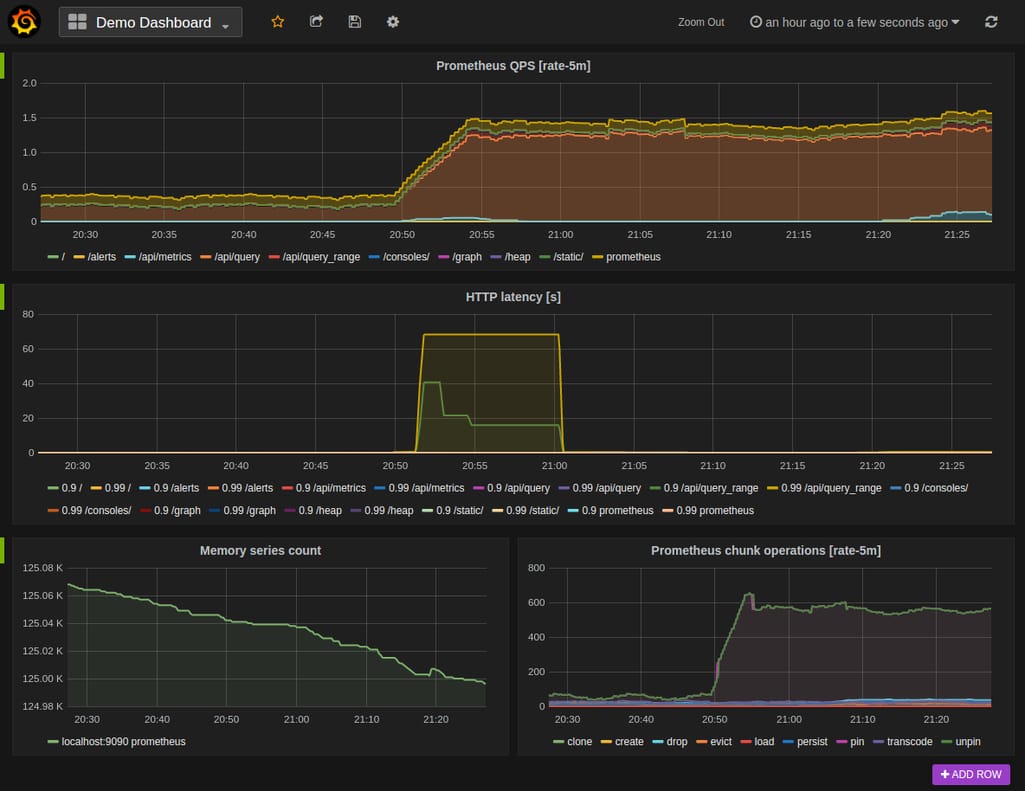
Grafana dashboard and metrics samples. Source: prometheus.io
The main method of monitoring is code instrumentation. Prometheus scrapes the metrics from the instrumented code to present it as a visual or numerics in the interface, or it sends them to the Alertmanager.
Sensu GO
Sensu GO works a bit differently. It’s an agent-based monitoring tool that uses small software components (agents) to monitor objects in your infrastructure. The pipeline of monitoring and alert gathering is automated. It allows you filter, process, or transform alerts.
Nagios
Nagios is also an agent-based monitoring tool that runs on a server as a service. The agents are assigned to the objects you want to monitor, and Nagios runs plugins that reside on the same server to extract metrics. The plugins in this case are scripts that run once in a while, monitoring the system.
As the metric is received, the system can send you an alert via an interface or SMS/Email. Alert reception is justified by the fact that Nagios is a legacy monitoring system.
Security and DevSecOps
DevOps strives to produce as much value for the customer as possible: This is done via CI/CD, automated testing, and constant monitoring. Frequent releases of smaller bits of code create more space to run software and security testing more precisely. Frequent minor releases make bugs easier to spot and fix right away.
However, with the advances of cloud computing, microservice architecture, and automated pipelines, more security vulnerabilities start to appear. DevSecOps is a practice of implementing security testing procedures in the whole DevOps process. With these issues in mind, we’ll look at some tools that help us with security checks.
Most of the tools present a toolset to track logs and run automated code tests.
Codacy
Codacy is a static analysis tool that runs code checks and helps developers spot style violations, duplications, and other anomalies that impact code security. With 30+ programming languages supported, Codacy is priced at $15 per month, when deployed in the cloud.
SonarQube
SonarQube offers the same functionality with 27 programming languages available. It integrates with most CI/CD tools and ensures continuous code testing for the team. SonarQube is available at no cost but with limitations. There are three other bundles for companies of different sizes, priced accordingly. Request pricing.
Logz.io
Logz.io. This is an open-source log management and analytical solution. It provides built-in analytical interface, reporting, and integrations with third-party services to complement the general workflow.
But let’s elaborate on DevSecOps: The general idea of a practice is not to utilize more security automation software. This is truly similar to what DevOps is and how it’s often treated by the teams. DevSecOps, as well as DevOps, first of all concerns building a collaborative mindset but through the prism of security. It fosters the culture of mutual responsibility for code security. As far as every member is involved in the stages of development
How to make the right tool choice?
DevOps pipelines are certainly complex. It requires a lot of effort to choose the tools for every stage of a process, integrate them with each other, and customize for your needs. While specific tools for containers or code testing are similar in functions or don't present many options, middleware for CI/CD and configurations are more complex.
Analyze the skillset of your team and decide which members of a team will be working with these tools. As we mentioned, the CI/CD tools will differ in languages available for programming and configuration methods. If your DevOps team is development-dominant, imperative methods are preferred. Declarative methods are often familiar to operations staff.
Google suggests running few activities to test the tooling choice when the pipeline is already running:
- Assess tech stacks to evaluate the efficiency and convenience of the existing system.
- Proactively investigate new tools for the pipeline or look at the market from time to time to find the tools that can fit better than the existing ones.
- Schedule time for tool experiments.
- Conduct presentations to initiate discussion of the tools used and opportunities to migrate onto another product.
Such an approach allows you to keep track of technology trends and maintain the discussion around the existing tools across the team.