

There are few things in the world requiring such precision as clinical decision-making. The adoption of technologies supports healthcare organizations on different levels: from population monitoring, health records, diagnostics, and clinical decisions, to drug procurement, and accounting. Technologies not only support actual treatment and data management, but also help optimize healthcare operations all over the industry. But more importantly, they enable us to process the growing amount of accumulated medical data.
The data is already being stored digitally: More than 95 percent of health facilities report implementing Electronic Health Records (EHR) systems. A large part of data comes from widely adopted IoT devices used in 60 percent of hospitals in the US today. Receiving patient or operation information, the healthcare industry's next big step is data analytics applied to various processes in patient treatment, equipment maintenance, and diagnostics.
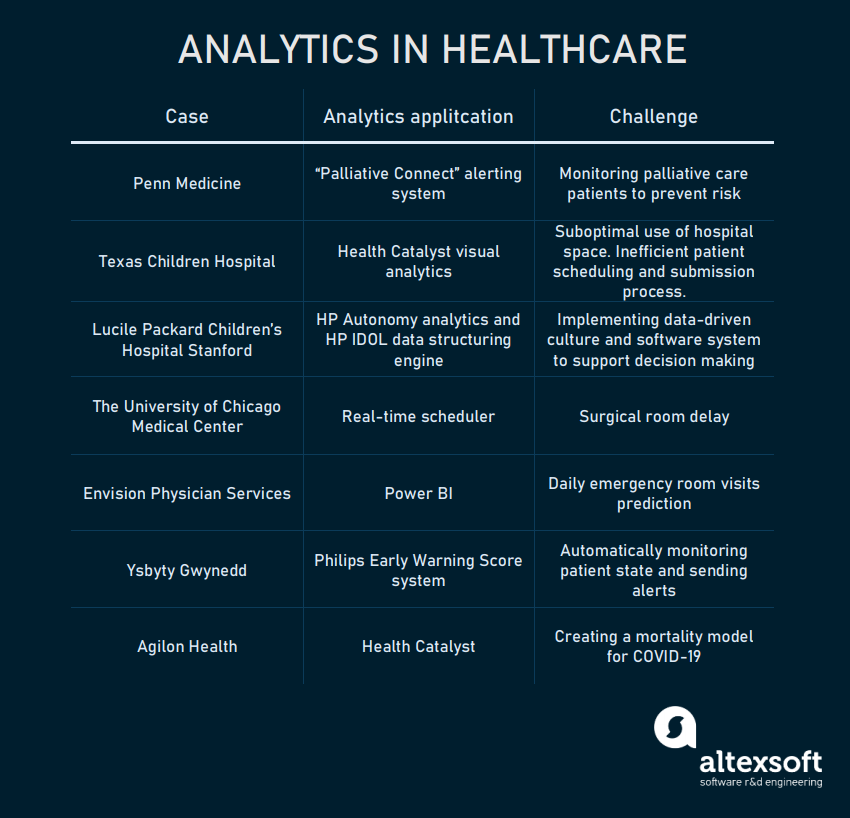
Collecting data and making sense of it to predict health conditions of individuals is a primary task of healthcare analytics. To learn general terms of data processing, take a look at our business intelligence article. Technologies such as machine learning are widely applied to automate medical data analysis around the globe. So, in this article, we’re going to explore some real-world examples of healthcare analytics. We’ll look at 7 cases of data helping health facilities to optimize their operations and offer better treatment.
In 2017, Penn launched trigger system Palliative Connect. The system uses a machine learning algorithm that extracts data from patients' EHRs, analyzing around 30 parameters to prepare predictions. Based on the historical and real-time data, ML algorithms can tell clinicians which patient is in the risk zone within several months by sending alerts. That way doctors can proactively respond to the patient’s needs.
The result: According to the published pilot testing results, during the testing period, 57 percent of triggered consults were approved by the control expert team. Compared to historical data, the rate of consultations increased by 74 percent.
Based on the DOS platform, Texas Children’s Hospital created an analytical interface that provided visual representation of current space. Sourcing EHR data, they managed to calculate occupancy, relying on appointment time, required space, support staff, and workstations to calculate optimal space. The system presents this data in a form of visual map that updates every time a utilization request is approved.
The result: The hospital managed to increase its revenue by $86 thousand in nearly six months, with approximately 550 additional appointments.
Another part of optimization touched upon patient schedules. Texas Children’s Hospital applied Health Catalyst DOS and Practice Management systems to optimize scheduling and appointment process:
The patient submission process turned to a centralized intake team that distributed patients among appointed clinicians.
The core capability of the system is the connection with various clinical and financial data sources via more than 400 data connectors and support of over 150 data types. Provisioned for medical workers and administration through a dedicated analytical interface as reports and visualizations, these can be used to get insights from the historical data on past treatment efficiency, symptomatology, and patient response to specific types of drugs.
As a part of healthcare specific features, LPCH analytics has a custom integration with the Systematized Nomenclature of Medicine (SNOMED) taxonomy database that provides access to more than two million clinical concepts. International Classification for Disease (ICD) coding is also included to make it easy to integrate with industry healthcare systems.
The key value brought by the HP IDOL engine was innovative for healthcare analytics, as it allowed LPCH to work with unstructured data. Standard analytical instruments utilized in the industry can process only structured data. Which by claims of Dr. Alan Stein, vice president at HP Healthcare Analytics, causes healthcare organizations’ failure “to analyze up to 90 percent of their information.”
But not only success stories can be told about the experience. Informs Journal of Applied Analytics describes numerous cases of ML model implementation for LPCH. One of the key objectives through model implementation was to use predictive power of ML by analyzing EHRs to:
Utilizing real-time data and machine learning algorithms, the hospital managed to schedule operating room activity to pass them between the teams with minimum time waste. The system is based around real-time alerts by consuming real-time data to optimize performance.
The result: Turnover time decreased by 15-20 percent per room with an approximately $600 thousand increase in annual revenue.
The analytical system sources data from Envision’s billing and patient scheduling databases. The machine learning model applied to this data makes predictions on expected daily emergency room visits with 80 percent accuracy. The provided information helps emergency room operation teams to organize staff and required equipment in advance, optimizing patient serving.
The result: optimized performance of emergency rooms. The same analytical systems installed in approximately 100 clinical facilities supported by Envision Physician Services.
Ysbyty Gwynedd hospital was one of the early adopters of Philips EWS. Eliminating the need for nurses to manually check patients, it automatically monitored multiple individuals at once. If a patient's health is deteriorating, an alert will be sent via the interface to medical staff. The data is uploaded directly to the Patient Administration System and can be accessed by doctors via a central dashboard.
The result: The system helped Ysbyty Gwynedd hospital reduce adverse events by 24 percent and led to an 86 percent reduction in cardiac arrests.
The data included prior researches, studies that covered factors like demographics, comorbidities, population density across certain regions, etc. Combining these factors, Agilon Health created a model that considered individual risk scores for the US population. During a one-week period, the Agilon team managed to contact nearly 50 percent of the covered patient base giving precautions and mitigating the risk for those who were in older age groups.
Appointments with the medical staff shifted to telehealth channels (consultancy and diagnostics on the web) to minimize clinician exposure to the virus.
The result: As stated in Health Catalyst case study, Agilon Health managed to
One of these spheres is predictive maintenance, which is basically a machine learning task aimed at predicting expiration or breakage of equipment that requires replacement over time. The healthcare industry is critically sensitive to system breakdowns and downtimes, especially in the case of life-supporting systems. An prime example of predictive maintenance for healthcare hardware is Hitachi. Reporting breakdown detection in several months, Hitachi claims to reduce downtime by 16 percent.
Data analytics can also operate different sources. Big data can be a powerful tool for disease prevention, as it allows us to gather more essential information. Further, it can be used for population health screening, diagnostics, and deep learning-based screening.
The data is already being stored digitally: More than 95 percent of health facilities report implementing Electronic Health Records (EHR) systems. A large part of data comes from widely adopted IoT devices used in 60 percent of hospitals in the US today. Receiving patient or operation information, the healthcare industry's next big step is data analytics applied to various processes in patient treatment, equipment maintenance, and diagnostics.
Collecting data and making sense of it to predict health conditions of individuals is a primary task of healthcare analytics. To learn general terms of data processing, take a look at our business intelligence article. Technologies such as machine learning are widely applied to automate medical data analysis around the globe. So, in this article, we’re going to explore some real-world examples of healthcare analytics. We’ll look at 7 cases of data helping health facilities to optimize their operations and offer better treatment.
Analytics application cases in healthcare
Predicting palliative care patients risk: Penn Medicine
Penn Medicine is a major multi-hospital organization that leverages predictive analytics to reduce risk for patients with critical illness. Mitigating the possible risks of injuries or sequela is called palliative care. It includes various caregiving tasks for patients that have severe illnesses and are monitored by clinicians.In 2017, Penn launched trigger system Palliative Connect. The system uses a machine learning algorithm that extracts data from patients' EHRs, analyzing around 30 parameters to prepare predictions. Based on the historical and real-time data, ML algorithms can tell clinicians which patient is in the risk zone within several months by sending alerts. That way doctors can proactively respond to the patient’s needs.
The result: According to the published pilot testing results, during the testing period, 57 percent of triggered consults were approved by the control expert team. Compared to historical data, the rate of consultations increased by 74 percent.
Optimization of clinical space usage: Texas Children's Hospital
Texas Children's Hospital faced the problem of suboptimal utilization of hospital space for years, which decreased the hospital's overall revenue and slowed down the serving of patients. With the help of Health Catalyst Data Operating System (DOS), they created a data-driven solution.Based on the DOS platform, Texas Children’s Hospital created an analytical interface that provided visual representation of current space. Sourcing EHR data, they managed to calculate occupancy, relying on appointment time, required space, support staff, and workstations to calculate optimal space. The system presents this data in a form of visual map that updates every time a utilization request is approved.
The result: The hospital managed to increase its revenue by $86 thousand in nearly six months, with approximately 550 additional appointments.
Another part of optimization touched upon patient schedules. Texas Children’s Hospital applied Health Catalyst DOS and Practice Management systems to optimize scheduling and appointment process:
The patient submission process turned to a centralized intake team that distributed patients among appointed clinicians.
- An online scheduling tool was leveraged to allow self-scheduling through the web.
- The hospital also established a template for allocating scheduling time in four-hour blocks. Appointments of different duration were allocated to different time blocks. All the unfilled appointments were distributed in a 72-hour time zone to close the gap.
- Weekend appointments and extended hospital hours were added.
- An annual revenue increased by $8.3 million with 53 thousand appointments respectively
- 30 thousand online schedules
- 39 percent patient satisfaction rate growth
Applying machine learning to predict operation duration and disease risk probability: Lucile Packard Children’s Hospital Stanford
Lucile Packard Children’s Hospital (LPCH), part of the Stanford University Health system, is a global pediatric and obstetric medicine leader. In partnership with HP Autonomy’s, LPCH developed an analytical platform based on the HP IDOL search and analytical engine. IDOL is an algorithm designed for recognizing patterns and connections in large sets of unstructured data. Utilizing IDOL to structure the data in disparate healthcare data sources, LPCH gave medical workers access to health information from various clinical systems.The core capability of the system is the connection with various clinical and financial data sources via more than 400 data connectors and support of over 150 data types. Provisioned for medical workers and administration through a dedicated analytical interface as reports and visualizations, these can be used to get insights from the historical data on past treatment efficiency, symptomatology, and patient response to specific types of drugs.
As a part of healthcare specific features, LPCH analytics has a custom integration with the Systematized Nomenclature of Medicine (SNOMED) taxonomy database that provides access to more than two million clinical concepts. International Classification for Disease (ICD) coding is also included to make it easy to integrate with industry healthcare systems.
The key value brought by the HP IDOL engine was innovative for healthcare analytics, as it allowed LPCH to work with unstructured data. Standard analytical instruments utilized in the industry can process only structured data. Which by claims of Dr. Alan Stein, vice president at HP Healthcare Analytics, causes healthcare organizations’ failure “to analyze up to 90 percent of their information.”
But not only success stories can be told about the experience. Informs Journal of Applied Analytics describes numerous cases of ML model implementation for LPCH. One of the key objectives through model implementation was to use predictive power of ML by analyzing EHRs to:
- Identify patients at clinical decline risk
- Prevent central line-associated bloodstream infections
- Predict surgical operation duration
Operation room delay reduction: The University of Chicago Medical Center
The University of Chicago Medical Center faced a problem with surgical room delays. Operating room usage cost ranges from $22 to $133 per minute and remains one of the largest expenses for medical institutions. The delays are caused because of the number of staff involved in surgical operations and preparations held between each operation.Utilizing real-time data and machine learning algorithms, the hospital managed to schedule operating room activity to pass them between the teams with minimum time waste. The system is based around real-time alerts by consuming real-time data to optimize performance.
The result: Turnover time decreased by 15-20 percent per room with an approximately $600 thousand increase in annual revenue.
Daily emergency room visits prediction: Envision Physician Services
Operating across 900 clinical facilities, Envision Physician Services implemented analytics solutions to predict daily emergency room visits. A cloud-based system utilized Azure SQL Database and Power BI interface for reporting features.The analytical system sources data from Envision’s billing and patient scheduling databases. The machine learning model applied to this data makes predictions on expected daily emergency room visits with 80 percent accuracy. The provided information helps emergency room operation teams to organize staff and required equipment in advance, optimizing patient serving.
The result: optimized performance of emergency rooms. The same analytical systems installed in approximately 100 clinical facilities supported by Envision Physician Services.
Monitoring patient state deterioration: Ysbyty Gwynedd
With the launch of Philips General Wards solutions, a patient monitoring system, numerous clinical facilities adopted the technology as an in-house alerting system. These types of systems are also called Early Warning Score (EWS) designed to monitor vital patient parameters, automatically detect decrease in patient’s health state, and send alerts to clinicians.Ysbyty Gwynedd hospital was one of the early adopters of Philips EWS. Eliminating the need for nurses to manually check patients, it automatically monitored multiple individuals at once. If a patient's health is deteriorating, an alert will be sent via the interface to medical staff. The data is uploaded directly to the Patient Administration System and can be accessed by doctors via a central dashboard.
The result: The system helped Ysbyty Gwynedd hospital reduce adverse events by 24 percent and led to an 86 percent reduction in cardiac arrests.
Leveraging data to create COVID-19 mortality model: Agilon Health
It’s impossible to ignore data analysis applications related to the COVID-19 pandemic. For example, Agilon Health used DOS platform by Health Catalyst to gather population symptomatology and mortality data across Italy, China, and the US.The data included prior researches, studies that covered factors like demographics, comorbidities, population density across certain regions, etc. Combining these factors, Agilon Health created a model that considered individual risk scores for the US population. During a one-week period, the Agilon team managed to contact nearly 50 percent of the covered patient base giving precautions and mitigating the risk for those who were in older age groups.
Appointments with the medical staff shifted to telehealth channels (consultancy and diagnostics on the web) to minimize clinician exposure to the virus.
The result: As stated in Health Catalyst case study, Agilon Health managed to
- create a COVID-19 model for approximately 125,000 individuals that were assigned with risk scores.
- increase one partner location’s telehealth appointments from none in the first week to 2,200 in weeks 12 and 13, aligning with social distancing and overall pandemic policies.
What are the other opportunities of data analytics in healthcare?
While case studies reveal the real-world state of things, we have to mention other spheres that are not highlighted by healthcare organizations – yet. Data opens up numerous opportunities for operations improvements.One of these spheres is predictive maintenance, which is basically a machine learning task aimed at predicting expiration or breakage of equipment that requires replacement over time. The healthcare industry is critically sensitive to system breakdowns and downtimes, especially in the case of life-supporting systems. An prime example of predictive maintenance for healthcare hardware is Hitachi. Reporting breakdown detection in several months, Hitachi claims to reduce downtime by 16 percent.
Data analytics can also operate different sources. Big data can be a powerful tool for disease prevention, as it allows us to gather more essential information. Further, it can be used for population health screening, diagnostics, and deep learning-based screening.