
It’s been a long time since it became obvious that to develop and stay competitive, business decision-making required the support of data. But, easier said than done.
Today, we have access to bigger volumes of a variety of data than ever before, but just collecting those facts and numbers is not enough. It’s vital to understand what information can be useful and give a better understanding of business processes -- not only to measure success, but also aid in making decisions. In other words, a certain number of metrics and KPIs has to be set up, monitored, and analyzed to be turned into valuable insights.
In the hospitality industry, choosing the right metrics and carefully tracking them can help you as the hotelier or hotel manager to understand how your hotel is performing, compare it with your competitors, and possibly find the weak points and opportunities for improvement.
So, the aim of this article is to describe the main KPIs typically adopted by hotels to support their business analysis. To make it as clear as possible, we’ll demonstrate all the calculations through examples using the same numbers of a hypothetical hotel.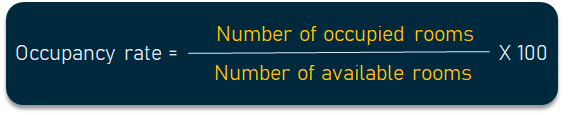
What does it show? An occupancy rate is measured by dividing the number of occupied rooms by the number of available rooms and multiplying by 100, showing the percentage of rooms occupied at a specific moment.
For example, if you have a 10-room hotel and last night you sold 5 rooms, then the occupancy rate would be 50 percent. In further calculations we will use 0.5 which is the same as 50 percent.
Why use it? Despite its simplicity, the occupancy rate is an important KPI that shows how full your hotel is. Monitoring it over time lets you understand how your hotel is performing in different periods. It might show you that your property is most popular on the weekends or during a holiday season, or when some sporting events take place nearby. In any case, you will know better what to focus your marketing efforts on to get that desired “No vacancy!” sign on your door.
Important to understand. Many hoteliers prioritize the occupancy rate and focus on increasing its value, forgetting that the ultimate goal is to increase revenue not fill up the rooms. There are cases when higher occupancy doesn’t lead to bigger profit (for example, when you lower the rates), so you have to use it carefully in combination with other measurements to get a fuller picture.
Also note that only the rooms that are in service and ready to be rented out are meant by available rooms, excluding the ones that are under maintenance or taken by staff members.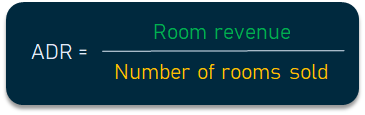
What does it show? ADR is used to calculate the average rental revenue per occupied room at a given time. To find ADR, divide your total room revenue by the number of rooms sold.
For example, if you sold 5 rooms out of your 10-room hotel and your total revenue was $2,000, then ADR would be $400. Obviously, it makes sense to calculate the metric only if you have different room rates, otherwise its value is pretty evident.
Why use it? ADR is one of the essential performance indicators that basically shows how much money each room brings you. You can monitor it throughout time (it’s great if its value increases) and compare it to your competitors to make decisions about your pricing strategy.
Important to understand. ADR can be deceiving as it only tells you one part of the story. It takes into account neither your unsold rooms, nor the revenue that comes from other sources (bar, spa, restaurant, tours, etc.), nor the associated costs. So, it’s a useful performance metric by itself, displaying the room-specific revenue, but it won’t show you the complete picture of your property’s financial results.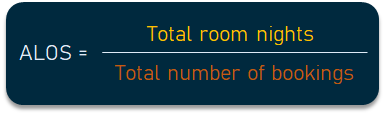
What does it show? ALOS identifies the average number of nights your guests spend at your hotel and is calculated by dividing the total room nights by the total number of bookings.
For example, in April the number of room nights was 200 (out of maximum 300 for a 10-room hotel), with a total of 50 bookings. Then, ALOS is 4 days.
Why use it? It’s better if ALOS is higher since shorter stays mean increased guest turnover resulting in larger labor costs. You can influence ALOS by adjusting your revenue management strategy and offering discounts for longer bookings or increasing your one-night rate. A more aggressive approach can be applied during a busy season when high demand is expected such as setting a minimum length of stay restriction to minimize short-term stays.
Important to understand. ALOS can differ a lot depending on the focus of your hotel. For example, if you have a property in Las Vegas and you mostly accept guests coming for a weekend getaway or a B&B in the downtown of Chicago with a focus on business travelers, your hotel ALOS would probably be shorter than for a resort in Cancun aimed at vacation tourists.
Today, we have access to bigger volumes of a variety of data than ever before, but just collecting those facts and numbers is not enough. It’s vital to understand what information can be useful and give a better understanding of business processes -- not only to measure success, but also aid in making decisions. In other words, a certain number of metrics and KPIs has to be set up, monitored, and analyzed to be turned into valuable insights.
In the hospitality industry, choosing the right metrics and carefully tracking them can help you as the hotelier or hotel manager to understand how your hotel is performing, compare it with your competitors, and possibly find the weak points and opportunities for improvement.
So, the aim of this article is to describe the main KPIs typically adopted by hotels to support their business analysis. To make it as clear as possible, we’ll demonstrate all the calculations through examples using the same numbers of a hypothetical hotel.
Occupancy rate, ADR, and ALOS: basic operational metrics
Let's start with the simple measurements that give the broadest overview of your hotel.Occupancy rate
What does it show? An occupancy rate is measured by dividing the number of occupied rooms by the number of available rooms and multiplying by 100, showing the percentage of rooms occupied at a specific moment.
For example, if you have a 10-room hotel and last night you sold 5 rooms, then the occupancy rate would be 50 percent. In further calculations we will use 0.5 which is the same as 50 percent.
Why use it? Despite its simplicity, the occupancy rate is an important KPI that shows how full your hotel is. Monitoring it over time lets you understand how your hotel is performing in different periods. It might show you that your property is most popular on the weekends or during a holiday season, or when some sporting events take place nearby. In any case, you will know better what to focus your marketing efforts on to get that desired “No vacancy!” sign on your door.
Important to understand. Many hoteliers prioritize the occupancy rate and focus on increasing its value, forgetting that the ultimate goal is to increase revenue not fill up the rooms. There are cases when higher occupancy doesn’t lead to bigger profit (for example, when you lower the rates), so you have to use it carefully in combination with other measurements to get a fuller picture.
Also note that only the rooms that are in service and ready to be rented out are meant by available rooms, excluding the ones that are under maintenance or taken by staff members.
ADR (Average Daily Rate)
What does it show? ADR is used to calculate the average rental revenue per occupied room at a given time. To find ADR, divide your total room revenue by the number of rooms sold.
For example, if you sold 5 rooms out of your 10-room hotel and your total revenue was $2,000, then ADR would be $400. Obviously, it makes sense to calculate the metric only if you have different room rates, otherwise its value is pretty evident.
Why use it? ADR is one of the essential performance indicators that basically shows how much money each room brings you. You can monitor it throughout time (it’s great if its value increases) and compare it to your competitors to make decisions about your pricing strategy.
Important to understand. ADR can be deceiving as it only tells you one part of the story. It takes into account neither your unsold rooms, nor the revenue that comes from other sources (bar, spa, restaurant, tours, etc.), nor the associated costs. So, it’s a useful performance metric by itself, displaying the room-specific revenue, but it won’t show you the complete picture of your property’s financial results.
ALOS (Average Length of Stay)
What does it show? ALOS identifies the average number of nights your guests spend at your hotel and is calculated by dividing the total room nights by the total number of bookings.
For example, in April the number of room nights was 200 (out of maximum 300 for a 10-room hotel), with a total of 50 bookings. Then, ALOS is 4 days.
Why use it? It’s better if ALOS is higher since shorter stays mean increased guest turnover resulting in larger labor costs. You can influence ALOS by adjusting your revenue management strategy and offering discounts for longer bookings or increasing your one-night rate. A more aggressive approach can be applied during a busy season when high demand is expected such as setting a minimum length of stay restriction to minimize short-term stays.
Important to understand. ALOS can differ a lot depending on the focus of your hotel. For example, if you have a property in Las Vegas and you mostly accept guests coming for a weekend getaway or a B&B in the downtown of Chicago with a focus on business travelers, your hotel ALOS would probably be shorter than for a resort in Cancun aimed at vacation tourists.
RevPAR, GOPPAR, CPOR, NOI, and other financial metrics for revenue management
In short, hotel revenue management is a combination of distribution and pricing strategies aimed at maximizing income.

Check our video on how revenue management works in hospitality
Revenue management, among other things, is based on careful tracking of certain KPIs and adjusting a hotel’s revenue strategy according to changes that took place or are predicted and expected. Let’s take a look at those metrics.RevPAR (Revenue per Available Room)
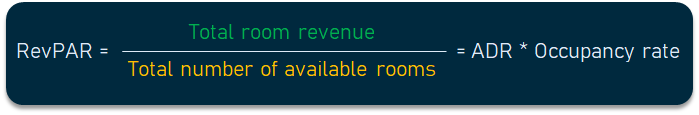
What does it show? RevPAR shows the amount of revenue generated by one room, whether booked or not. There are two ways to calculate it. You can either divide your total room revenue by the total number of available rooms OR multiply ADR by the occupancy rate.
For example, selling 5 rooms out of 10 brought you $2,000, so your RevPAR equals $200 (you’re getting the same result by multiplying your ADR of $400 by the occupancy rate of 0.5.)
Why use it? RevPAR is one of the most popular metrics in hospitality. It’s similar to ADR, but takes the unsold room into account, giving a more accurate picture. Needless to say, hoteliers have to aim at increasing their RevPAR since it reflects both the pricing for rooms and the ability to fill them.
Important to understand. Just like ADR, RevPAR doesn’t include additional revenue from other sources, so it only shows the inventory performance. It also doesn’t take into account any operational costs and other expenses and can’t be used to measure profitability. Besides, the calculation is on the per-room basis, so sometimes large hotels have a smaller RevPAR, but still generate higher total revenue. Read on to learn about more demonstrative indicators.
TRevPAR (Total Revenue per Available Room)
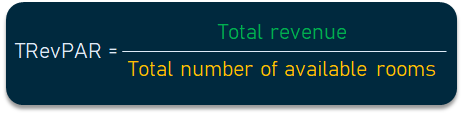
What does it show? TRevPAR is measured by dividing your total revenue (from room rental and other sources) by the total number of available rooms. This metric shows the amount of total revenue of the hotel per one room.
For example, you have a revenue of $2,000 from the 5 booked rooms out of ten available rooms. The revenue of the restaurant is $1,000 and the revenue of the spa is $500. With the total gross revenue of $3,500, TRevPAR equals $350.
Why use it? TRevPAR solves one of the problems of RevPAR as it includes the additional revenue streams in the calculation. It might not be significant for smaller properties that only rely on rental payments, but it becomes an important indicator for hotels managing multiple points of sale. Revenue managers have to focus on this KPI to develop the revenue potential of all hotel departments and adjust the package offers as well as the entire upselling strategy.
Important to understand. Same as RevPAR, this KPI doesn’t consider any input costs, so it can’t show the ultimate profit.
RevPAC (Revenue per Available Customer)
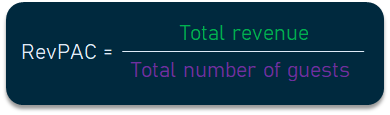
What does it show? RevPAC shows the amount of revenue per guest. To define it, divide the total revenue by the total number of hotel guests. You can also make the calculation including customers that do not stay at the hotel, but only come to use the amenities, if you have such an option for visitors.
For example, you sold 3 double rooms and 2 family rooms for 4 people which brought you $2000. They ate at the restaurant for a total of $1,000 and used the spa services for $500. Besides, 16 people visited your bar, resulting in another $700. Then, your RevPAC per each of your 30 guests would come to $140.
Why use it? RevPAC demonstrates how much value each guest brings to your property. It’s especially useful if you have multiple amenities open to non-sleeping guests, such as a bar or restaurant, spa, shops, car rental, casino, water or amusement park, etc. You can also monitor it if you host conferences or other events that generate income (and offer opportunities for upselling.)
Important to understand. You can obtain the same room revenue from a single guest or a family of several people, but a group would spend more on food, entertainment, or tours. RevPAC can also help you monitor how well your amenities are performing and if they are paying off.
GOPPAR (Gross Operating Profit per Available Room)
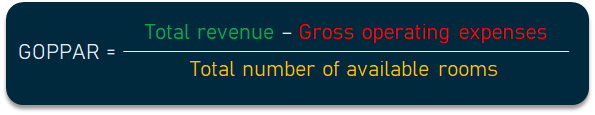
What does it show? GOPPAR demonstrates how much gross operating profit comes from each room. Gross operating profit is your total revenue minus gross operating expenses, and if you divide the result by the total number of available rooms, you’ll obtain your GOPPAR.
For example, your total net revenue is $3,500 and your gross expenses are $1,700. So gross operating profit would be $1800. Divided by the 10 rooms, GOPPAR equals $180. If you want to see the yearly GOPPAR, you have to use the yearly values of the revenue and expenses and multiply the number of rooms by 365.
Why use it? GOPPAR is a strong performance indicator as it goes further than the revenue-related KPIs and incorporates operational expenses. So, this metric reflects how much money your hotel actually makes, allows you to understand its actual value, and measures its bottom line.
Important to understand. There are variances in calculating GOPPAR depending on the costs taken into account. Generally speaking, there are 2 main groups of expenses:
- variable costs that are any operational expenses that change depending on the number of rooms sold, i.e., breakfast, supplies, cost to clean the room, incremental energy, etc.; and
- fixed costs that are paid on a monthly basis to maintain property such as rent, payroll, Internet bills, etc.
Monitoring GOPPAR through both peak and low seasons will show you if your expenses are balanced. Besides, if you’re developing your business, adding new services, or just changing the structure of your expenditure, GOPPAR will show you if your efforts pay off.
CPOR (Cost per Occupied Room)
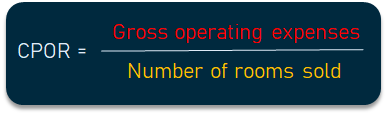
What does it show? CPOR is measured by simply dividing gross operating expenses by the number of rooms sold to show how much every sold room costs you.
For example, you have 5 rooms occupied and your total operating expenses are $1,700. The CPOR would be $340.
Why use it? CPOR is a crucial KPI that allows you to monitor your expenses. It’s often used to calculate the minimum rate per room since you obviously shouldn’t charge less than you spend.
Important to understand. Here again different ways of calculation exist as sometimes only room-related costs are considered. In this way, you can find the average variable expenses per room, which is also good to know. However, if you want to define your minimum room rate, we advise including both variable and fixed costs to avoid losses.
ARPAR or Adjusted RevPAR (Adjusted Revenue per Available Room)
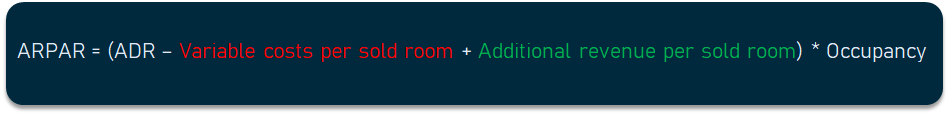
What does it show? ARPAR shows how much profit each room brings you, considering variable costs (we’ve explained this figure in the GOPPAR section) and additional revenue. To calculate ARPAR, first subtract the variable costs per sold room from your ADR, add the amount of additional revenue per sold room, and then multiply the result by your occupancy rate.
For example, your ADR is $400 and your occupancy is 50% with 5 rooms sold out of 10. Let’s say your variable costs are $750 (which is $150 per room) and the additional revenue is $1,500 (which is $300 per room). Then, your ARPAR would be $275.
Why use it? Developed and introduced in 2015 by industry expert Ira Vouk as a new index for profit maximization, ARPAR proved to be way more accurate and useful than RevPAR as it accounts for variable expenses and also considers ancillary revenue-generating POS. In this way, it gives a better picture of inventory profitability, showing the net revenue created by each occupied room.
Important to understand. ARPAR doesn’t include fixed costs, which can be quite significant, so it still can’t be used for measuring your property’s overall profitability. Also, it’s hard to use it for benchmarking purposes since variable costs and additional amenities often differ across hospitality businesses.
NOI (Net Operating Income)
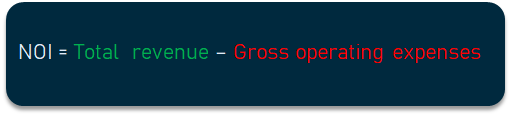
What does it show? An NOI shows whether your property is making a profit or loss. To find it you have to subtract your gross operating expenses from your total revenue.
For example, you made $3,500 from room sales, restaurant, and spa. Your gross expenses are $1,700, making that day's NOI $1,800. To calculate your weekly, monthly, or yearly NOI, you have to take the corresponding total figures.
Why use it? Income is what’s left after you paid your expenses. So, NOI is the KPI that finally defines the bottom line, or absolute financial result of your activity. It’s the most important metric for owners and investors as it clearly shows your property’s ability to generate profit.
Important to understand. The NOI is the income before tax and doesn’t consider some groups of expenses such as interest on loans and amortization. In other industries, it’s referred to as EBIT -- earnings before interest and taxes.
MPI, ARI, and RGI: benchmarking metrics to understand the position among competitors
Looking at your reports in isolation can’t tell you whether those numbers are cause for concern or celebration. Comparing your performance against your competitors is an important activity and has to be conducted regularly as it allows you to see potential areas for improvement. Knowing the industry standards or analyzing how industry leaders are performing can help you identify your own weaknesses and adjust your strategy accordingly.For more effective benchmarking, you first have to create your own competitive set of hotels that share the same market segment and are similar in main criteria such as location, size, range of services, etc.
Once you come up with such a set, you’ll have to do a bit of research to find out what your competitors’ KPIs are. A common way of getting that kind of information is through a STR Report that provides data on 67,000 hotels in 180 countries.
With the necessary numbers, you can perform the competitive analysis. Note, that all the indexes described below can be calculated by a simple division or can be turned into a percentage by multiplying the result by 100. Besides, you can compare your metrics to the market average, to market leaders, or any specific hotel that you might have a rivalry with.
MPI (Market Penetration Index)
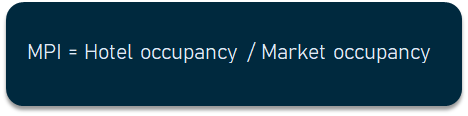
What does it show? MPI (also known as occupancy index) compares your hotel’s occupancy to that of your competitors. It’s calculated by dividing your hotel occupancy by the market/other hotel occupancy.
For example, your occupancy rate is 50 percent and the market average is 80 percent. The MPI would be 0.625, which is less than 1, meaning that your rate is lower.
Why use it? As obvious as it may seem, it’s an important indicator to track. Basically, it shows if customers choose your hotel over others.
Important to understand. As we’ve already mentioned, occupancy is not the best indicator of success as it doesn’t account for revenue (dropping rates can raise occupancy and the MPI but lead to financial losses). So, MPI is useful for knowing how your hotel stands in the market but can’t be used to evaluate its performance.
ARI (Average Rate Index)
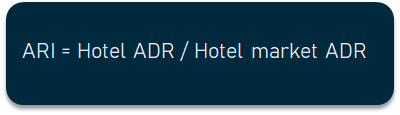
What does it show? An ARI is found by dividing your hotel’s ADR by the market ADR. It measures how your average rates compare to other hotels in your competitive set.
For example, your ADR is $400 and your leading competitor has $500. So, ARI equals 0.8.
Why use it? ARI gives an idea of what the average market prices are and helps adjust your pricing strategy. If it’s less than 1, it means that you are undercharging and possibly losing revenue because of lower rates.
Important to understand. ARI has to be tracked together with occupancy and, again, with other revenue-focused KPIs. Even though low value of ARI is considered a sign of poor performance, it can be a result of your marketing strategy and intentionally dropped rates to attract more guests and boost occupancy.
RGI (Revenue Generation Index)
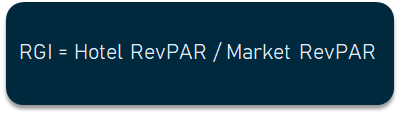
What does it show? RGI (also called RevPAR index) compares your RevPAR to that of your competitors and is obtained by dividing your hotel’s RevPAR by that of a market or another hotel.
For example, your RevPAR is $200 and the neighboring property gets $160. RGI comes to 1.25, which is a good result as it's more than 1.
Why use it? As we said, RevPAR is one traditional metric used to measure performance, blending occupancy and rates. So, RGI can show if you’re getting a fair share of the market in relation to your competitors.
Important to understand. Remember the disadvantages of RevPAR we mentioned above and don’t consider it the ultimate focus of your strategy.
CSAT, NPS, CES: customer-related metrics to support marketing
The next group of metrics we’ll briefly discuss are not specific to hotels but are still important to monitor since understanding customers and their experience is essential for any service-focused business.Customer satisfaction metrics
Guest satisfaction is not always easy to measure and you often have to deal with qualitative feedback data extracted from post-stay surveys and online reviews (read our post about sentiment analysis to know how to extract insights from such review data). However, there are certain metrics that you can easily obtain and monitor.CSAT (Customer satisfaction score). Asking a simple straightforward question like “How satisfied were you with your experience/our services?” with easy-to-choose scale options, say, from 0 to 10, can provide you with a measurable and trackable result. You can include such a question in your surveys or add it at the end of chatbot interaction.

Simple customer opinion collection, source: helphouse
NPS (Net Promoter Score). NPS is a good way to measure your customers’ loyalty. NPS surveys typically consist of a rating question, e.g., “How likely are you to recommend our company to a friend or colleague?”, and an open-ended question that prompts respondents to explain their choice. Read our article dedicated to the Net Promoter Score for more information.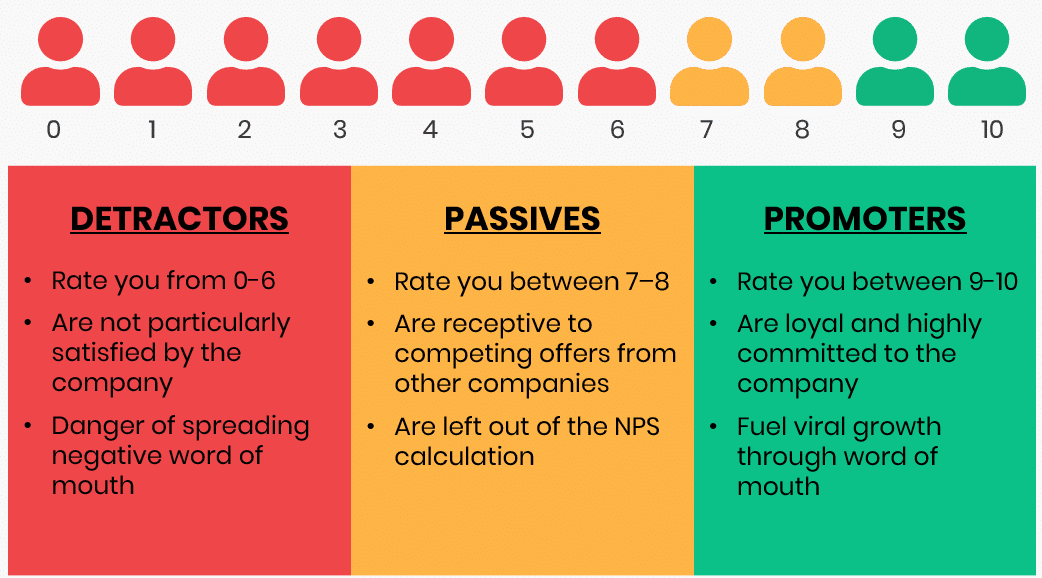
What is a good NPS? Source: Netigate
CES (Customer Effort Score). CES can be used to measure how easy and comfortable it was for your customers to interact with your brand, whether it was booking a room on your website, getting assistance from a support team, or using your mobile app.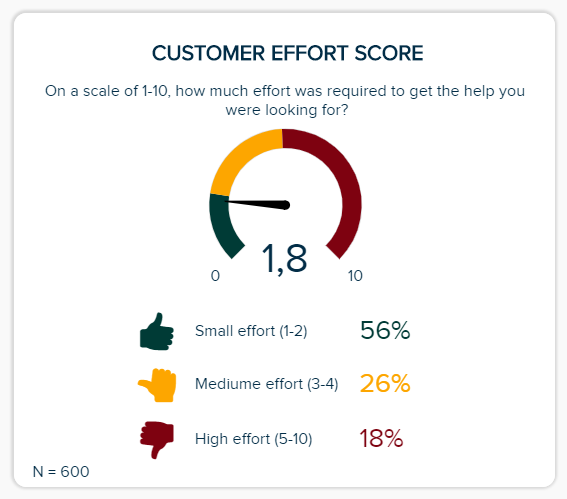
Sample CES calculation, source: datapine
Customer segmentation
Segmentation is not actually about the metrics, but rather about better understanding who your main customers are. It’s an extremely important marketing practice because once you have that knowledge, you can create effective marketing strategies aimed at different segments to provide a personalized experience to every guest.Typically, the 4 main types of segmentation are
- demographic segmentation -- grouping by age, gender, ethnicity, occupation, income, religion, etc.;
- psychographic segmentation -- grouping by lifestyle, interests, values, etc.;
- geographic segmentation -- grouping by geographic location, city vs rural origin, etc.; and
- behavioral segmentation -- grouping based on the previous customer behavior with your brand, i.e., purchase patterns, preferred payment methods, preferred types of communication, sales channels, etc.
Website metrics to measure online engagement
This group of metrics is also not industry-specific, but it’s obvious that global digitization gives websites a huge role. According to the study by Fuel Travel, 86.7 percent of all travelers visit a hotel’s website before booking. So, analyzing user behavior to understand your website performance is a must to ensure a pleasant online experience for your guests.The information for tracking these metrics can be taken from the Google Analytics tool or any other alternative instrument that allows you to track customer online behavior.

Google Analytics interface, source: B2C
Here, we’ll just briefly go over a few of the metrics to give you an idea of the value they can bring.Bounce rate shows the percentage of visitors who leave your website quickly without doing anything. If your bounce rate is high, it means that your content isn’t interesting or engaging enough.
CTR or click-through rate is the percentage of users who actually clicked on your link after seeing it in the search results or an online ad. If your CTR is low, it’s worth changing your meta title or description to make it more appealing.
New visitors vs returning visitors shows the ratio of first-time visitors and the ones that have already visited before. If you have many returning visitors, it’s a good sign as it might mean that you have a lot of loyal customers. If not, it’s a reason for working on your customer retention strategy.
Conversion rate is the most important measurement of success as it shows the share of people that actually made a booking through your site.
Time on site or Average session duration is how much time visitors spend on your website. If you get a lot of traffic but the session duration is low, it might be a sign to optimize your content.
Link sharing when the link to your website is shared on social media, blogpost, or other sites, is the ultimate stage of engagement and is a sign that you’re doing a good job! Unless, of course, it’s the negative reference, but we’re sure it’s not your case.
Final thoughts: measure, analyze, optimize... repeat
As they say, “If you don’t measure it, you can’t change it.” Not measuring your KPIs is like walking blindfolded -- you don’t know where you’re going and what’s around you. In such a highly competitive industry as hospitality, it’s absolutely critical to create an efficient revenue management and development strategy based on accurate information.Remember that you don’t have to calculate and track all the metrics listed above. Choose those that work best for your business and maybe add others that have a significant impact on your performance (e.g., marketing ROI, labor costs, energy consumption, etc.). Implementing business intelligence software and integrating it with your property management system can greatly facilitate this process by automatically collecting necessary data, making accurate calculations, and visualizing trends.
Once you come up with the list, make sure you monitor it closely, analyze changes, and discover reasons behind fluctuations. As you extract insights, take the necessary optimization steps, watch how it affects your results -- and keep developing.