Let’s say you run a large online bookstore. It’s open 24/7. Users may place orders and pay for them literally every minute or second. That means your website must quickly process lots of transactions involving small amounts of data like order ID and details, user ID, or credit card data. Online transaction processing (OLTP) systems, namely databases and applications like a shopping cart, make it possible for an eCommerce business to work nonstop as it must.
Besides running daily operations, you may evaluate your performance. For instance, analyze sales for a given book or author during the previous month. It means you must collect transactional data and move it from the database that supports transactions to another system that can handle large volumes of data. And, as is common, to transform it before loading to another storage system.
Only after these actions can you analyze data with dedicated software (a so-called online analytical processing or OLAP system). But how do you move data? You need infrastructure, hardware and/or software, that will allow you to do that. You need an efficient data pipeline.
What is a data pipeline?
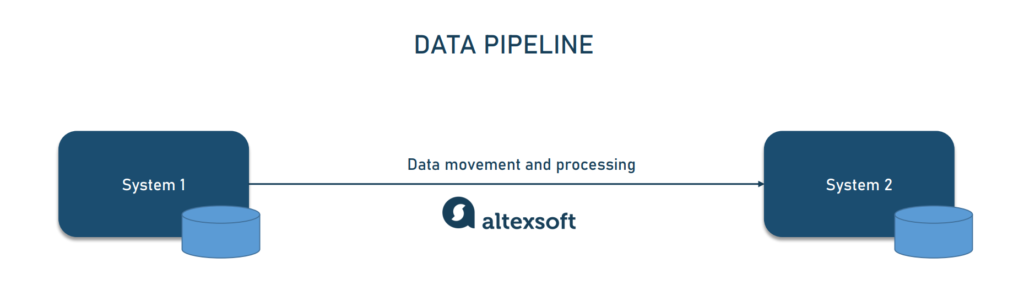
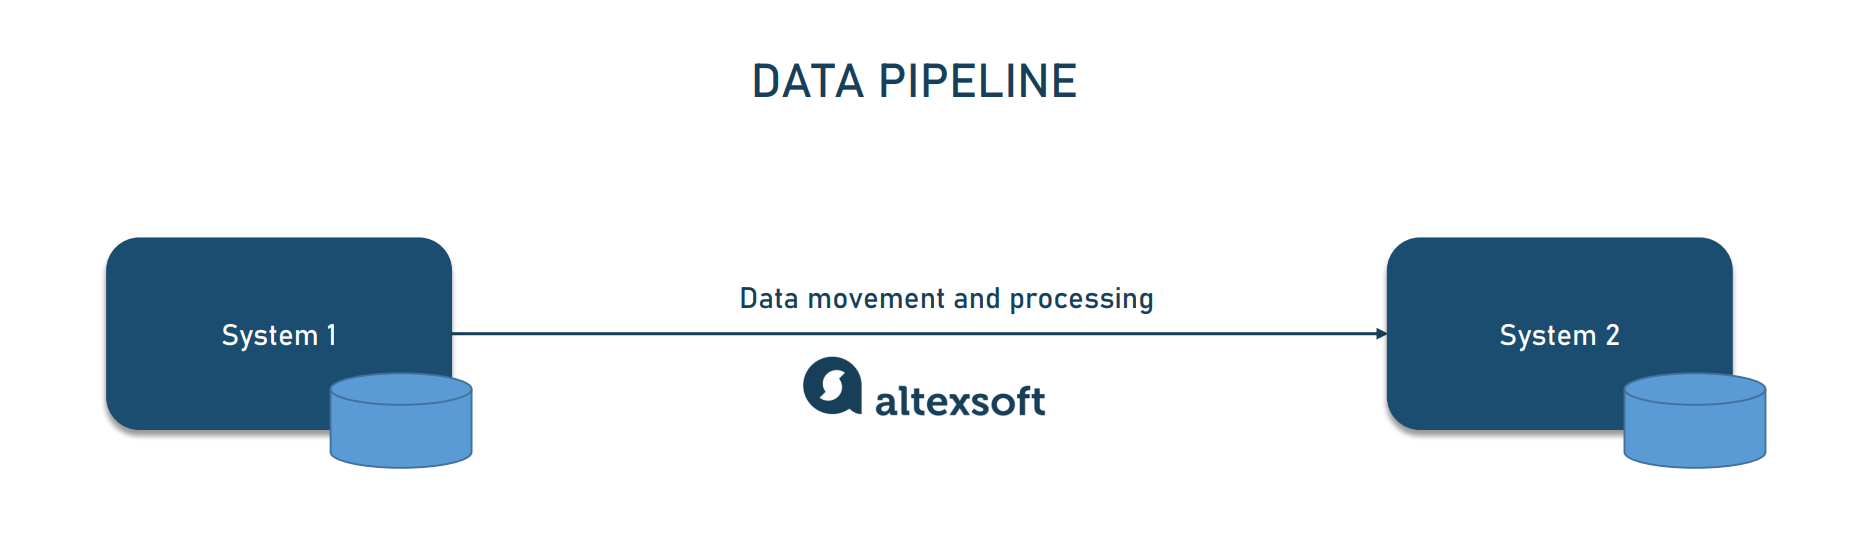
A data pipeline is a set of tools and activities for moving data from one system with its method of data storage and processing to another system in which it can be stored and managed differently. Moreover, pipelines allow for automatically getting information from many disparate sources, then transforming and consolidating it in one high-performing data storage.
The simplest illustration of a data pipeline
Imagine that you’re gathering various data that shows how people engage with your brand. That can be their location, device, session recordings, purchase and customer service interaction history, feedback shared, and more. And then you place these pieces of information in one place, a warehouse, creating a profile for each customer.
Thanks to data consolidation, everyone who uses data to make strategic and operational decisions or build and maintain analytical tools, can easily and quickly access it. These can be data science teams, data analysts, BI developers, chief product officers, marketers, or any other specialists that rely on data in their work.
Building and managing infrastructure for data movement and its strategic usage are what data engineers do.
Data pipeline vs ETL
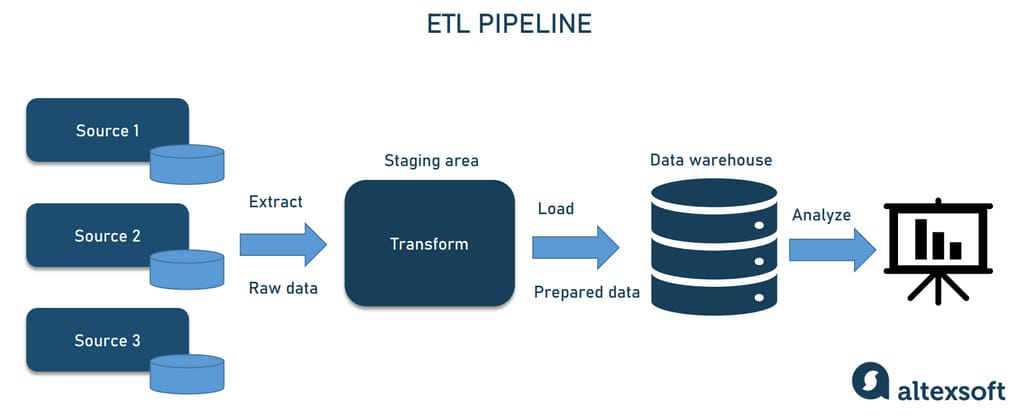
There's frequently confusion about a pipeline and ETL. So the first order of business is to clear that up. Simply started, ETL is just a type of data pipeline, that includes three major steps
Extract – getting/ingesting data from original, disparate source systems.
Transform – moving data in temporary storage known as a staging area. Transforming data to ensure it meets agreed formats for further uses, such as analysis.
Load – loading reformatted data to the final storage destination.
This is a common but not the only approach to moving data. For example, not every pipeline has a transformation stage. You simply don’t need it if source and target systems support the same data format. We’ll discuss ETL and other types of data pipelines later on.
When do you need a data pipeline?
Reliable infrastructure for consolidating and managing data helps organizations power their analytical tools and support daily operations. Having a data pipeline is necessary if you plan to use data for different purposes, with at least one of them requiring data integration — for example, processing and storing transaction data and conducting a sales trend analysis for the whole quarter.
To carry out the analysis, you will have to pull data from a number of sources (i.e., a transaction system, CRM, a website analytics tool) to access it from single storage and prepare it for the analysis. So, a data pipeline allows for solving “origin-destination” problems, especially with large amounts of data.
Also, the more use cases, the more forms data can be stored in, and the more ways it can be processed, transmitted, and used.
Data pipeline components
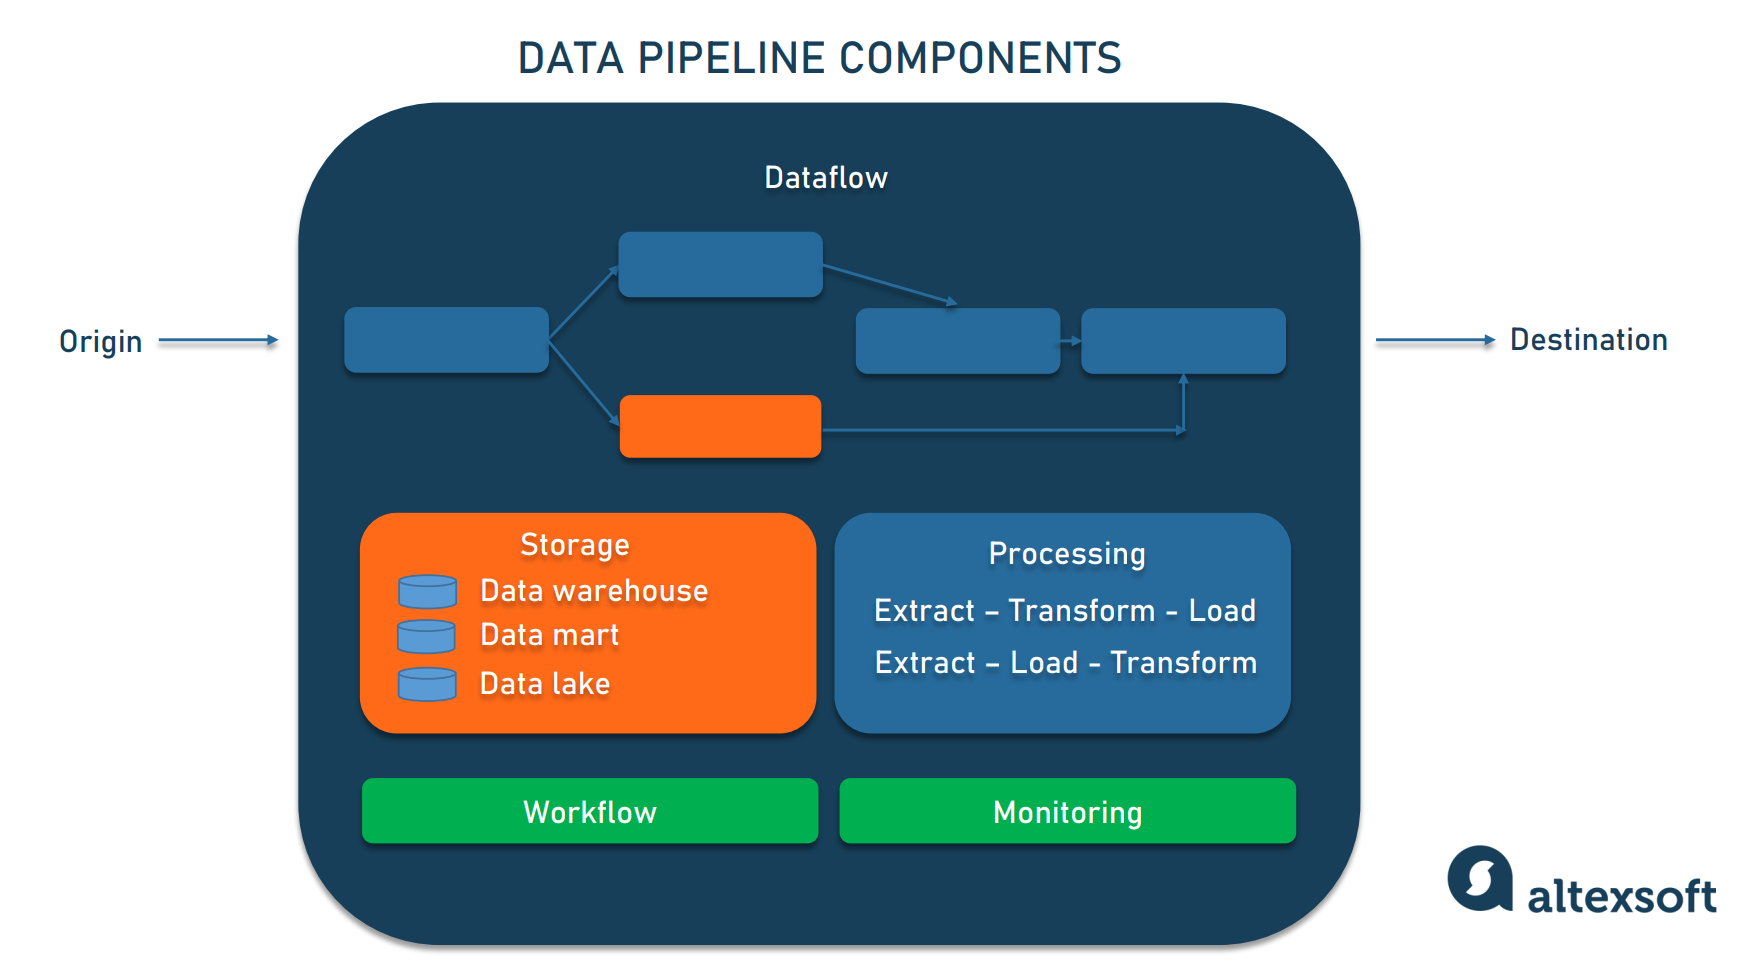
To understand how the data pipeline works in general, let’s see what a pipeline usually consists of. Senior research analyst of Eckerson Group David Wells considers eight types of data pipeline components. Let’s discuss them in brief.
Data pipeline components. Picture source example:Eckerson Group
Origin. Origin is the point of data entry in a data pipeline. Data sources (transaction processing application, IoT devices, social media, APIs, or any public datasets) and storage systems (data warehouse, data lake, or data lakehouse) of a company’s reporting and analytical data environment can be an origin.
Destination. The final point to which data is transferred is called a destination. Destination depends on a use case: Data can be sourced to power data visualization and analytical tools or moved to storage like a data lake or a data warehouse. We’ll get back to the types of storage a bit later.
Dataflow. That’s the movement of data from origin to destination, including the changes it undergoes along the way as well as the data stores it goes through.
Storage. Storage refers to systems where data is preserved at different stages as it moves through the pipeline. Data storage choices depend on various factors, for example, the volume of data, frequency and volume of queries to a storage system, uses of data, etc. (think of the online bookstore example).
Processing. Processing includes activities and steps for ingesting data from sources, storing it, transforming it, and delivering it to a destination. While data processing is related to the dataflow, it focuses on how to implement this movement. For instance, one can ingest data by extracting it from source systems, copying it from one database to another one (database replication), or by streaming data. We mention just three options, but there are more of them.
Workflow. The workflow defines a sequence of processes (tasks) and their dependence on each other in a data pipeline. Knowing several concepts – jobs, upstream, and downstream – would help you here. A job is a unit of work that performs a specified task – what is being done to data in this case. Upstream means a source from which data enters a pipeline, while downstream means a destination it goes to. Data, like water, flows down the data pipeline. Also, upstream jobs are the ones that must be successfully executed before the next ones – downstream – can begin.
Monitoring. The goal of monitoring is to check how the data pipeline and its stages are working: Whether it maintains efficiency with growing data load, whether data remains accurate and consistent as it goes through processing stages, or whether no information is lost along the way.
Data pipeline architecture
Data pipeline architecture describes the exact arrangement of components to enable the extraction, processing, and delivery of information. There are several common designs businesses can consider.
ETL data pipeline
As we said before, ETL is the most common data pipeline architecture, one that has been a standard for decades. It extracts raw data from disparate sources, transforms it into a single pre-defined format, and loads it into a target system — typically, an enterprise data warehouse or data mart.
pulling user data from multiple touchpoints to have all information on customers in one place (usually, in the CRM system),
consolidating high volumes of data from different types of internal and external sources to provide a holistic view of business operations, and
joining disparate datasets to enable deeper analytics.
The key downside of the ETL architecture is that you have to rebuild your data pipeline each time business rules (and requirements for data formats) change. To address this problem, another approach to data pipeline architecture — ELT — appeared.
ELT data pipeline
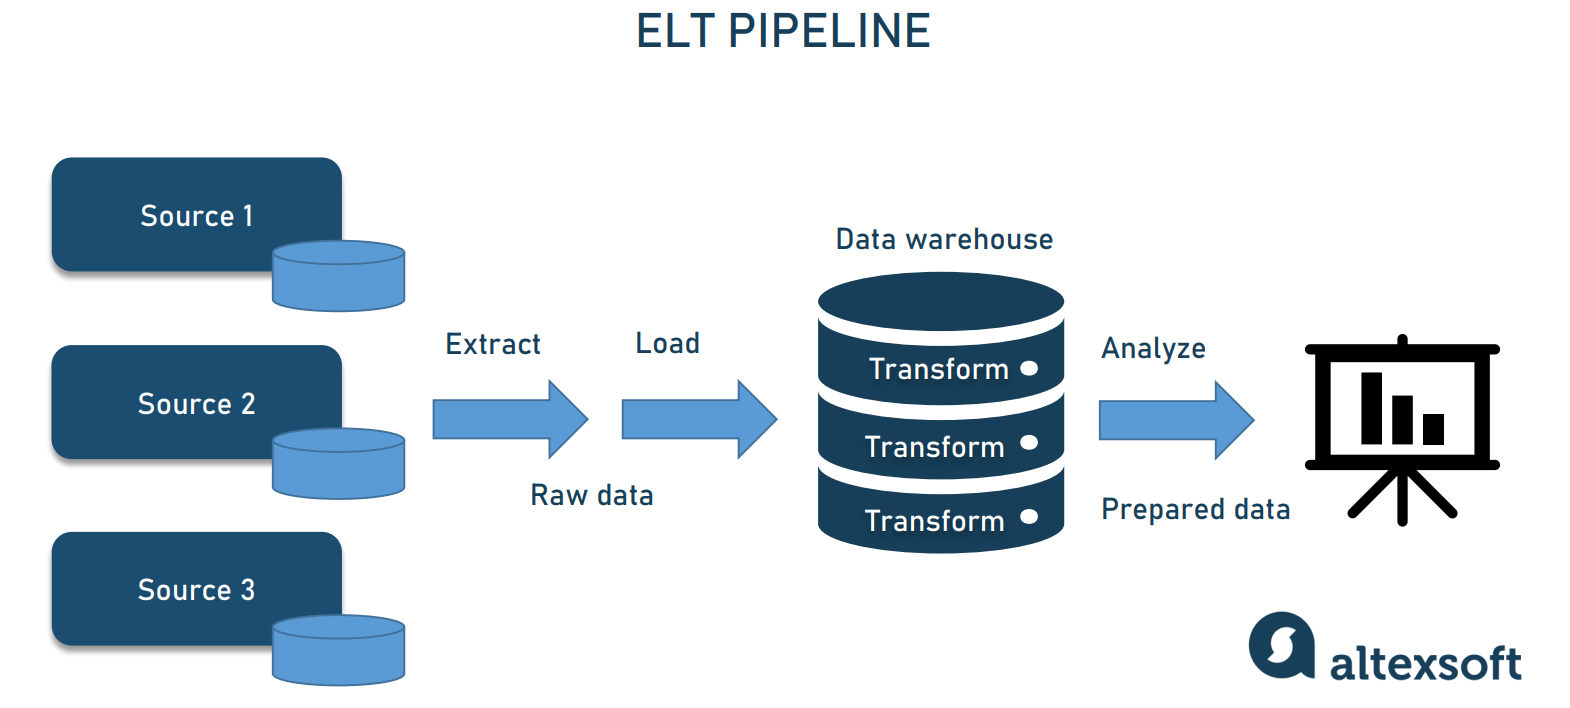
Intuition correctly suggests that ELT differs from ETL in the sequence of steps: loading happens before the transformation. This seemingly minor shift changes a lot. Instead of converting huge amounts of raw data, you first move it directly into a data warehouse or data lake. Then, you can process and structure your data as needed — at any moment, fully or partially, once or numerous times.
ELT pipeline architecture.
ELT architecture comes in handy when
you’re not sure what you’re going to do with data and how exactly you want to transform it;
the speed of data ingestion plays a key role; and
huge amounts of data are involved.
Yet, ELT is still a less mature technology than ETL which creates problems in terms of available tools and talent pool.
You can use either ETL or ELT architecture or a combination of the two as a basis for building a data pipeline for traditional or real-time analytics.
Batch pipeline for traditional analytics
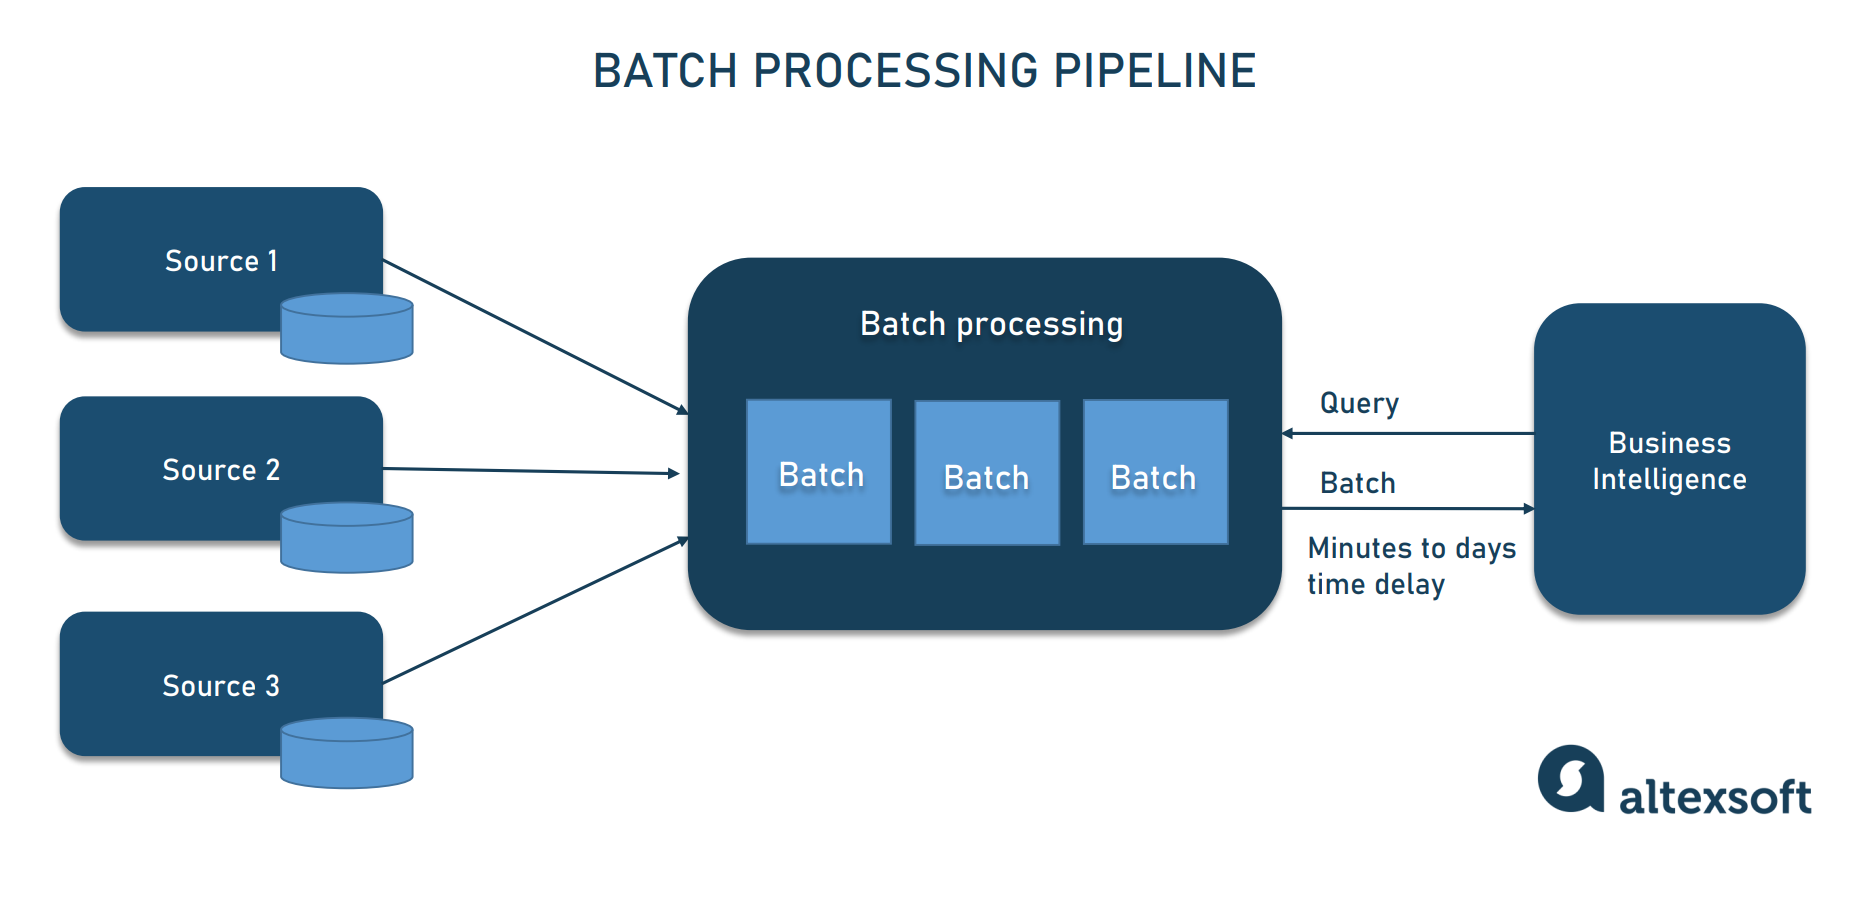
Traditional analytics is about making sense of data gathered over time (historical data) to support decision-making. It relies on business intelligence tools and batch data pipelines — when data is collected, processed, and published to a database in large blocks (batches), at one time or on regular schedules. Once ready for access, a batch is queried by a user or a software program for data exploration and visualization.
The logic behind batch data processing
Depending on the size of a batch, pipeline execution takes from a few minutes to a few hours and even days. To avoid overloading source systems, the process is often run during periods of low user activity (for example, at night or on weekends.)
Batch processing is a tried-and-true way to work with huge datasets in non-time-sensitive projects. But if you need real-time insights, better opt for architectures enabling streaming analytics.
Streaming data pipeline for real-time analytics
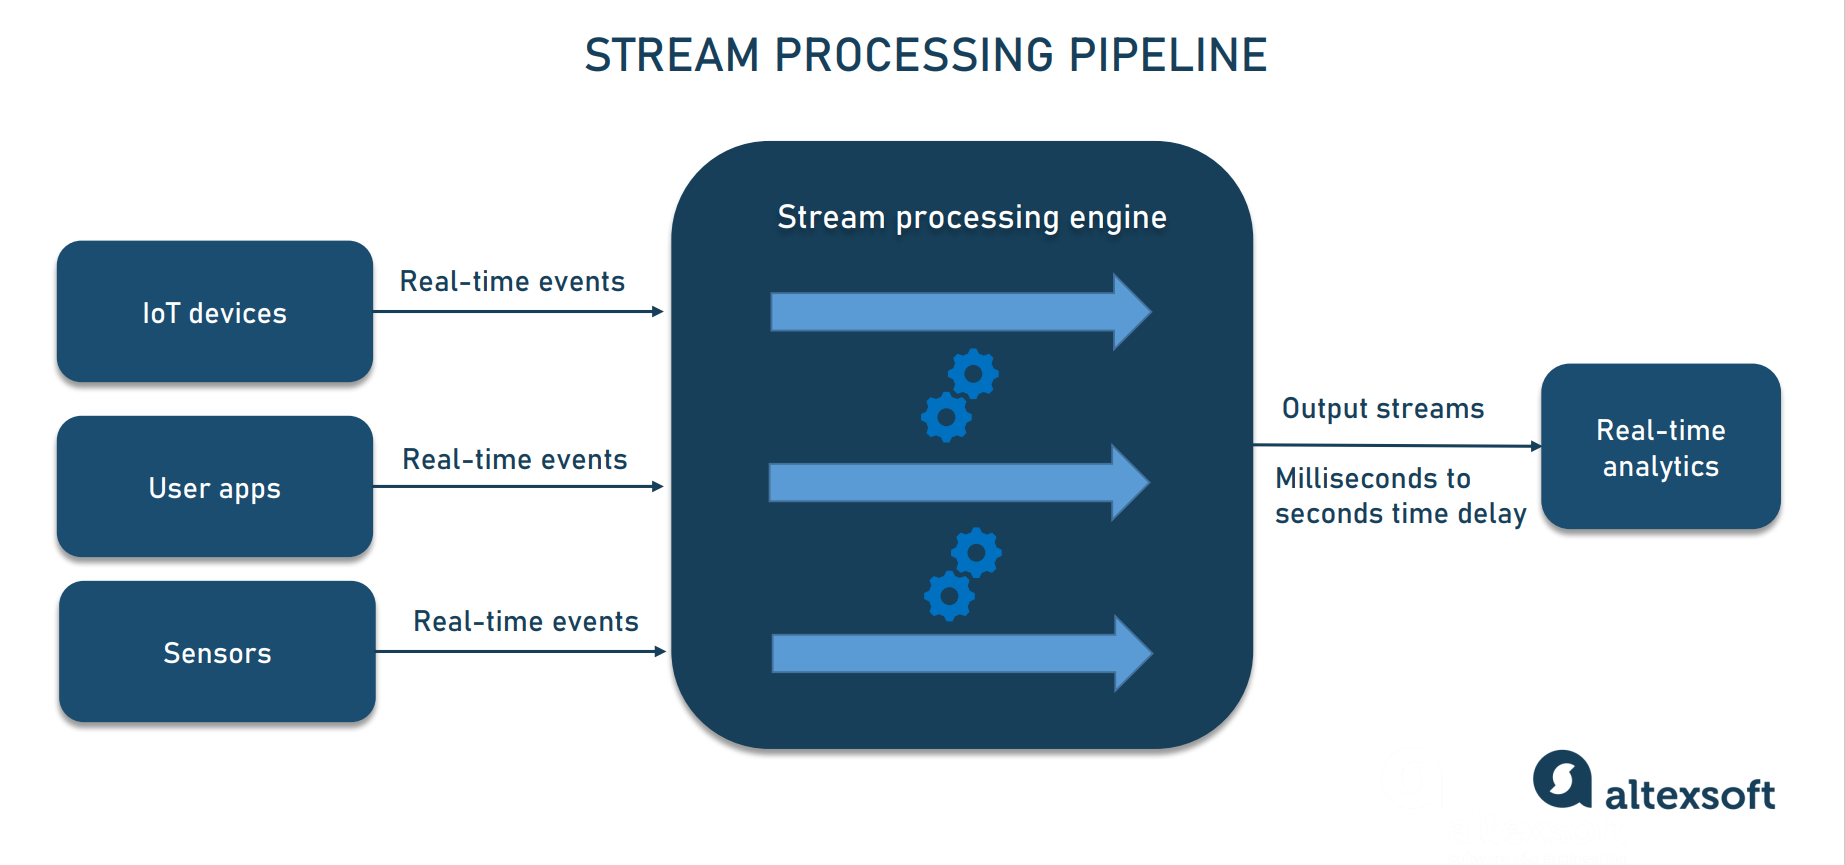
Real-time or streaming analytics is about deriving insights from constant flows of data within seconds or milliseconds. Unlike batch processing, a streaming pipeline ingests a sequence of data as it’s created and progressively updates metrics, reports, and summary statistics in response to every event that becomes available.
Stream data processing pipeline
Real-time analytics allows companies to get up-to-date information about operations and react without a delay, or to provide solutions for smart monitoring of infrastructure performance. Enterprises that can’t afford any lags in data processing — like fleet management businesses operating telematics systems — should prefer streaming architecture over batch.
Data streaming, explained
Big Data pipeline for Big Data analytics
Big Data pipelines perform the same tasks as their smaller counterparts. What differentiates them is the ability to support Big Data analytics which means handling
ELT loading infinite amounts of raw data and streaming analytics, extracting insights on the fly, seem to be perfect for a Big Data pipeline. Yet, thanks to modern tools, batch processing and ETL can also cope with massive amounts of information. Typically, to analyze Big Data, organizations run both batch and real-time pipelines, leveraging a combination of ETL and ELT along with several stores for different formats.
Data pipeline tools
These are tools and infrastructure behind data flow, storage, processing, workflow, and monitoring. The choice of options depend on many factors, such as organization size and industry, data volumes, use cases for data, budget, security requirements, etc. Some groups of instruments for data pipelines are as follows.
Data warehouses (DWs) are central repositories to store data transformed (processed) for a particular purpose. Today, all major DWs — such as Amazon Redshift, Azure Synapse, Google BigQuery, Snowflake, and Teradata — support both ETL and ELT processes and allow for stream data loading.
Data lakes store raw data in native formats until it’s needed for analytics. Companies typically use data lakes to build ELT-based Big Data pipelines for machine learning projects. All large providers of cloud services — AWS, Microsoft Azure, Google Cloud, IBM — offer data lakes for massive data volumes.
Batch workflow schedulers (Luigi or Azkaban) enable users to programmatically specify workflows as tasks with dependencies between them, as well as automate and monitor these workflows.
Big Data tools comprise all the above-mentioned data streaming solutions and other technologies supporting end-to-end Big Data flow. The Hadoop ecosystem is the number-one source of instruments to work with BD. You have
Amazon, Google, IBM, and Microsoft Azure also facilitate building Big Data pipelines on their cloud facilities.
Data pipeline examples
Now, that we’ve shed some light on the technical side of data pipelines, let’s look at who uses them and why and how they work in real life.
Dollar Shave Club built a data pipeline to power an ML-based recommendation engine
Dollar Shave Club is an American online store that delivers razors and men’s grooming products to more than 3 million subscribed members. Besides shooting hilarious commercials and succeeding in building a strong brand, the company has an efficient data infrastructure hosted on Amazon Web Services.
It uses a Redshift cluster as the central data warehouse that receives data from various systems, including production databases. “Data also moves between applications and into Redshift mediated by Apache Kafka,” said the company spokesperson. To collect event data from the web, mobile clients, as well as server-side applications, the company uses the Snowplow platform. Event data includes page views, link clicks, user browsing activity/behavior, and “any number of custom events and contexts.” Analytics platforms access data once it gets to the Redshift data warehouse.
Dollar Shave Club wanted to get even more data insights, so it developed a recommender system to define which products to promote and how to rank them in a monthly email sent to a specific customer. The engine is based on the Apache Spark unified analytics engine and runs on Databricks unified data analytics platform.
To enable the ETL process, the engineering team built an automated data pipeline on Spark. The pipeline works the following way:
Data is extracted from Redshift.
Data about a specific member's behavior is aggregated and pivoted to get features that describe them.
Selected features are included in the final predictive models.
The brand said that this product recommendation project was successful.
Hewlett Packard Enterprise switched to stream processing for its InfoSight solution
Hewlett Packard Enterprise (HPE) is a platform-as-a-service company providing data management, digital transformation, IT support, and financial services. One of their solutions, InfoSight, monitors the data center infrastructure they provide to customers.
Storage devices are equipped with sensors that collect performance data and send it to InfoSight. “HPE has over 20 billion sensors deployed in data centers all around the globe sending trillions of metrics each day to InfoSight, providing analytics on petabytes of telemetry data,” a case study says.
To enhance customer experience with the predictive maintenance feature, HPE needed to upgrade the infrastructure so it could enable near-real-time analytics. The answer was data architecture with support for streaming analytics. Also, the streaming application must be available all the time, recover from failures quickly, and be able to scale elastically.
The company used the Lightbend Platform to develop such an infrastructure. The platform includes several streaming engines (Akka Streams, Apache Spark, Apache Kafka) “for handling tradeoffs between data latency, volume, transformation, and integration,” besides other technologies.
Uber implemented streaming pipelines for near real-time feature computation
A global mobility service provider, Uber heavily relies on machine learning to run dynamic pricing (adjusting rates based on real-time data), calculate the maximum estimated time of arrival, forecast demand and supply, and perform other complex tasks.
Since the company aims at getting actionable insights in nearly real-time, it uses streaming pipelines that ingest current data from driver and passenger apps. The core component of the data flow infrastructure is Apache Flink, a distributed processing engine capable of computing features from supply and demand event streams. These features are fed to machine learning models to generate predictions on a minute-by-minute basis. At the same time, Uber exploits batch processing to identify medium-term and long-term trends.
Implementation options for data pipelines
You can implement your data pipeline using cloud services by providers or build it on-premises.
On-premises data pipeline. To have an on-premises data pipeline, you buy and deploy hardware and software for your private data center. You also have to maintain the data center yourself, take care of data backup and recovery, do a health check of your data pipeline, and increase storage and computing capabilities. This approach is time- and resource-intensive but will give you full control over your data, which is a plus.
Cloud data pipeline. Cloud data infrastructure means you don’t have physical hardware. Instead, you access a provider’s storage space and computing power as a service over the internet and pay for the resources used. This brings us to a discussion of the pros of a cloud-based data pipeline.
You don’t manage infrastructure and worry about data security because it’s the vendor’s responsibility,
Scaling storage volume up and down is a matter of a few clicks.
You can adjust computational power to meet your needs.
Downtime risks are close to zero.
Cloud ensures faster time-to-market.
Disadvantages of cloud include the danger of a vendor lock: It will be costly to switch providers if one of the many pipeline solutions you use (i.e., a data lake) doesn’t meet your needs or if you find a cheaper option. Also, you must pay a vendor to configure settings for cloud services unless you have a data engineer on your team.
If you struggle to evaluate which option is right for you in both the short and long run, consider talking to data engineering consultants.