Time series forecasting is hardly a new problem in data science and statistics. The term is self-explanatory and has been on business analysts’ agenda for decades now: The very first instances of time series analysis and forecasting trace back to the early 1920s.
Although an intern analyst today can work with time series in Excel, the growth of computing power and data tools allows for leveraging time series for much more complex problems than before to achieve higher prediction accuracy.
In this article, we’ll have a broad look at how time series forecasting is used, discuss several methods, and name the key tools that help data scientists put this technique to use.
What are time series forecasting and analysis?
Time series forecasting is a set of methods in statistics and data science to predict some variables that develop and change over time. The underlying intention of time series forecasting is determining how target variables will change in the future by observing historical data from the time perspective, defining the patterns, and yielding short or long-term predictions on how change occurs – considering the captured patterns.
Time series analysis focuses on understanding the dependencies in data as it changes over time. Unlike forecasting, it tries to answer the questions what happens? and why does that happen? Forecasting, on the other hand, corresponds to finding out what will happen.
Many machine learning and data mining tasks operate with datasets that have a single slice of time or don’t consider the time aspect at all. Natural language processing, image or sound recognition, and numerous classification and regression problems can be solved without time variables at all. For example, the sound recognition solution that we worked with entailed capturing specific teeth grinding sounds of patients as they slept. So, we weren’t interested in how these sounds change over time, but rather how to distinguish them from ambient sounds.
Time series problems, on the other hand, are always time-dependent and we usually look at four main components: seasonality, trends, cycles, and irregular components.
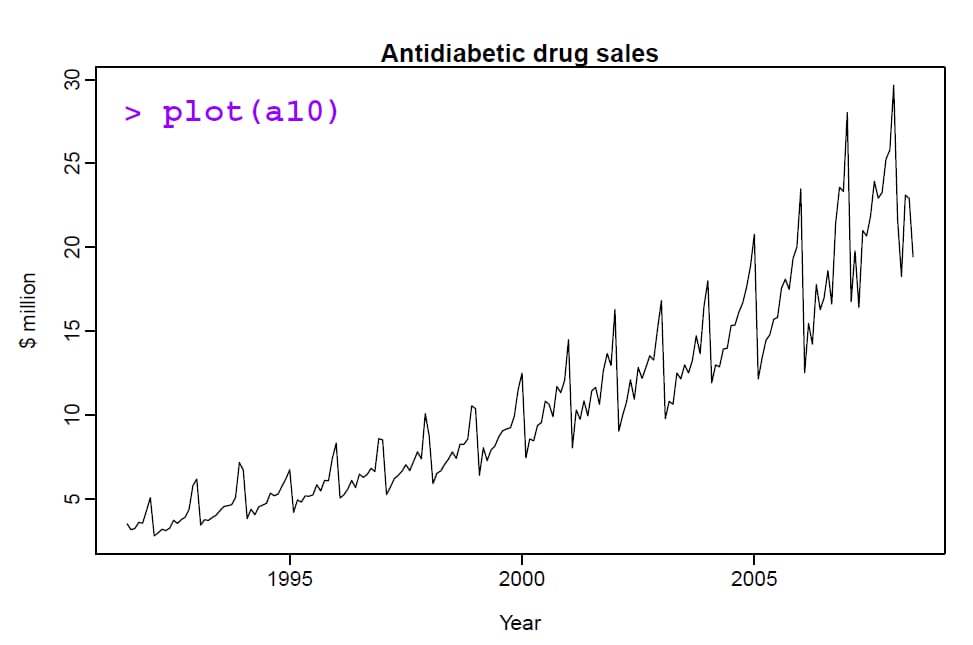
The graph above is a clear example of how trends and seasons work.
Trends. The trend component describes how the variable – drug sales in this case – changes over long periods of time. We see that the sales revenues of antidiabetic drugs have substantially increased during the period from the 1990s to 2010s.
Seasons. The seasonal component showcases each year’s wave-like changes in sales patterns. Sales were increasing and decreasing seasonally. Seasonal series can be tied to any time measurement, but these periods of time always have a fixed length and succession. We can consider monthly or quarterly patterns for sales in midsize or small eCommerce, or track micro-interactions across a day.
Cycles. Cycles are long-term patterns that have a waveform and recurring nature similar to seasonal patterns but with variable length, they don’t have a fixed time period. For example, business cycles have recognizable elements of growth, recession, and recovery. But the cycles themselves stretch in time differently for a given country throughout its history.
Irregularities. Irregular components appear due to unexpected events, like cataclysms, or are simply representative of noise in the data.
Time series forecasting and analysis: examples and uses cases
Time series forecasting is arguably one of the most common areas where machine learning is applied in business. Let’s discuss some use cases from our experience and other businesses.
Demand forecasting for retail, procurement, and dynamic pricing
Predicting customer demand is a cornerstone task for businesses that manage supplies and procurement. Another common application is predicting prices and rates for products and services that dynamically adjust prices depending on demand and revenue targets.
As a travel technology consulting business, we had experience working with a Japanese retail giant, Rakuten, that also has its hospitality branch. We used Rakuten's time series data on their hotel room sales as well as figures sourced from competing hotels. This data helped define the likeliest prices to help increase revenue. Seasonality variables considered prices depending on weekdays, holidays, and… well, seasons. Predictions also considered general hospitality market trends.
Price prediction for customer-facing apps and better user experience
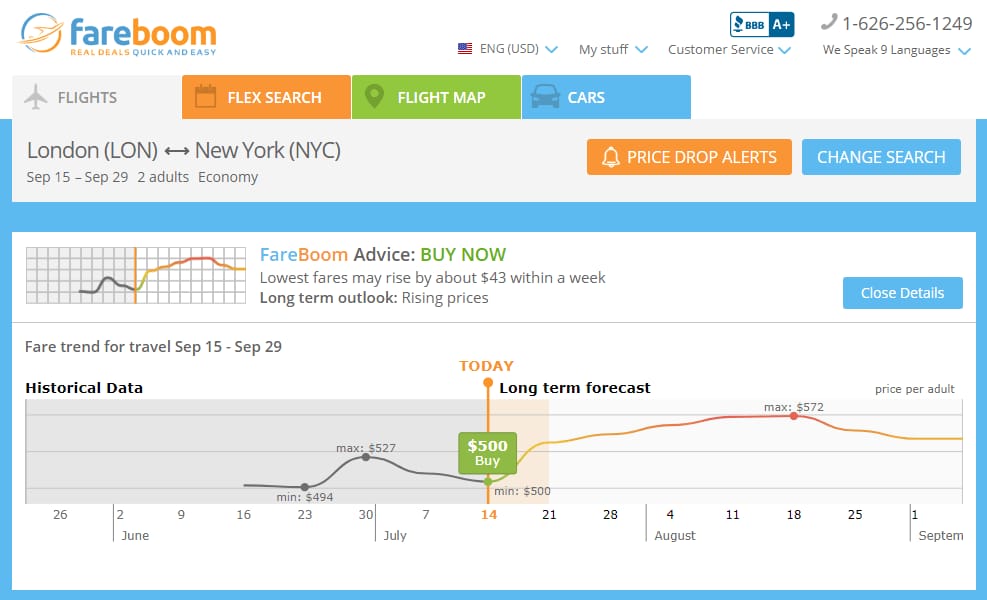
One of those cases is our client Fareboom.com. Fareboom is a flight-booking service that succeeds in finding the lowest airfares possible for its customers. The problem with airfares is that they change rapidly and without obvious reasons. Unless you’re buying tickets right before a trip, future pricing information would be advantageous. A great UX solution was to predict whether the prices are going to drop or increase in the near or distant future and give this information to customers. This encourages customer making return and makes Fareboom their go-to platform for optimizing their travel budgets.
Source: Fareboom.com
The engine has 75 percent confidence that the fares will rise soon
Giving away at least some of your analytics is a particularly good strategy for the travel industry and generally all businesses that connect people with end-service providers. If you have seasonal or trending data on the hotels that people enjoy during Christmas, why not turn it into recommendations?
Besides this obviously pertinent set of use cases, time series analysis and forecasting found their applications across almost all healthcare fields, from genetics to diagnosis and treatment.
There’s significant progress in both short- and long-term prognosis of medical conditions. For instance, times series forecasting is used to predict possible death after heart attacks to apply preventive care.
Anomaly detection for fraud detection, cyber security, and predictive maintenance
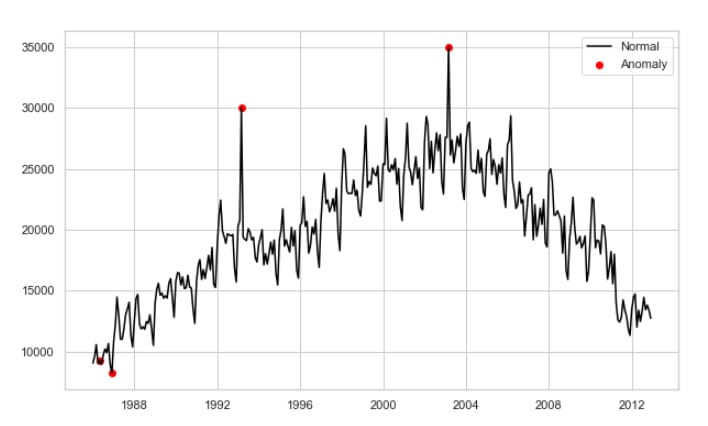
Anomaly detection is one of the common machine learning tasks that looks for outliers in the way data points are normally distributed. While it doesn’t necessarily has to be time series data, anomaly detection often goes hand in hand with it. Detecting anomalies in time series entails finding irregular spikes or valleys that significantly deviate from the way seasons and trends look.
Finding anomalies in time series data. Source: Neptune.ai
Fraud detection is a business-critical activity for any industry dealing with payments and other financial operations. PayPal -- an ML powerhouse when it comes to fraud detection -- applies time series analysis to track the normal frequency of operations of each account to find irregular spikes in the number of transactions. These findings are also checked against other suspicious activities, like recent changes in the shipping address or massive funds withdrawal, to highlight a given transaction as likely being fraudulent.
These techniques work for cyber security purposes. For instance, a number of research papers report effective use of time series analysis of IoT sensor data to capture malware attacks.
Besides cybersecurity, sensor time-series data lays the groundwork for predictive maintenance, the policy of forecasting machinery failure before it actually happens to reduce repair and downtime costs. By finding subtle anomalies in the current sensor readings, such systems can anticipate more dramatic events leading to failure. A number of research papers were published highlighting the use of time series forecasting for predictive maintenance, including the maritime industry, coal mining, ATMs work, and more.
Approaches to time series forecasting
“Prediction is very difficult, especially if it’s about the future.”
Nils Bohr, Nobel laureate in Physics
Today, time series problems are usually solved by conventional statistical (e.g., ARIMA) and machine learning methods, including artificial neural networks (ANN), support vector machines (SVMs), and some others. While these approaches have proved their efficiency, the tasks, their scope, and our abilities to solve the problems change. And the mere set of use cases for time series today has the potential to be expanded. As statistics step into the era of big data processing with the Internet of Things providing limitless trackable devices, and social media analysis, data scientists look for new approaches to handle this data and convert it into predictions.
So, let’s survey the main things that are happening in the field.
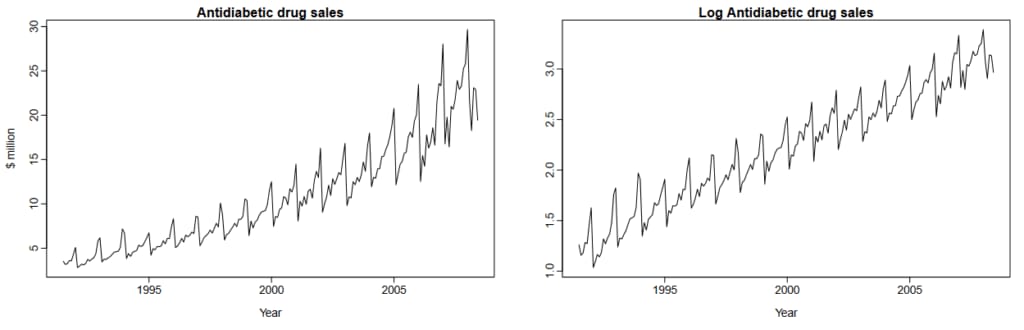
Traditional forecasting methods strive to bring stationarity into time series, i.e. make a number of statistical properties repeat constantly over time. Raw data doesn’t usually provide enough stationarity to yield confident predictions. For instance, to the graph of antidiabetic drug sales above, we must apply multiple mathematical transformations to render non-stationary time series at least approximately stationary. Then we’ll be able to find patterns and make predictions.
But time series in some fields are very resistant to our efforts as there are too many irregular factors that impact changes. Look at travel disruptions, especially those that happen during wars and pandemics. Traveler streams change, destinations change, and airlines are adjusting their prices differently making year-old observations nearly obsolete. Or crude oil prices, which are critical to predict for players across many industries, haven’t permitted us to build time series algorithms that would be precise enough.
Traditional machine learning methods
The traditional machine learning approach is to split an available historic dataset into two or three smaller sets to train a model and to further validate its performance against data that a machine hasn’t seen before. If we apply machine learning without the time series factor, a data scientist can choose the most relevant records from the available data and fit the model to them, leaving noisy and inconsistent records behind.
In time series, the main difference is that a data scientist needs to use a validation set that exactly follows a training set on the time axis to see whether the trained model is good enough. The problem with non-stationary records is that data in the training set might not be homogeneous to the testing set, as time series properties substantially change over the period that training and validation sets cover.
Stream learning approach
Here’s when we can use the stream learning technique. Stream learning suggests incremental changes to the algorithm – basically, its re-training. As a new record or a small set of them comes in, it updates the model instead of processing a whole set of data. This approach requires the understanding of two main things:
Data Horizon. How many new training instances are needed to update the model? For example, Shuang Gao and Yalin Lei from the China University of Geosciences applied stream learning to increase prediction accuracy in such non-stationary time series as crude oil prices mentioned above. They’ve set the data horizon as small as possible so that every update on the oil prices immediately updates the algorithm.
Data Obsolescence. How long does it take to start considering historic data or some of its elements irrelevant? The answer to this question may be quite tricky as it requires a share of assumptions based on domain expertise, basically, an understanding of how the market you work with changes and how many non-stationary factors bombard it. If your eCommerce business has significantly grown since last year both in terms of customer base and product variety, the data of the same quarter of the previous year may be considered obsolete. On the other hand, if the country experiences economic recession the new short-term data may be less enlightening than that of the previous recession.
While crude oil forecasts based on stream learning eventually perform better than conventional methods, they still show results that are only slightly better than a flipped coin does and stay in a ballpark of 60 percent confidence. They are also more complicated in development, deployment, and require prior business analysis to figure out data horizon and obsolescence.
Ensemble Methods
Another way to struggle with non-stationarity is ensemble models. Ensembling uses multiple machine learning and data mining methods to further combine their results and increase predictive accuracy. The technique has nothing to do with new approaches in data science, but it has critical meaning in terms of business decisions related to data science initiatives.
Basically, while building robust forecasting is expensive and time-consuming, it doesn’t narrow down to making and validating one or two models with further choosing of the best performer. In terms of time series, non-stationary components – like different durations of cycles, low weather predictability, and other irregular events that have an impact across multiple industries – make things even harder.
This was the problem for the Google team that was building time series forecasting infrastructure to analyze business dynamics of their search engine and YouTube with further disaggregating these forecasts for regions and small-time series like days and weeks. With Google engineers disclosing their approach, it became clear that even the Mount Olympus of AI-driven technologies chooses simpler methods over complex ones. They don’t use stream learning yet and settle for ensemble methods. But the main point that they express is that you need as many methods as possible to get the best results:
“So, what models do we include in our ensemble? Pretty much any reasonable model we can get our hands on! Specific models include variants on many well-known approaches, such as the Bass Diffusion Model, the Theta Model, Logistic models, bsts, STL, Holt-Winters and other Exponential Smoothing models, Seasonal and other ARIMA-based models, Year-over-Year growth models, custom models, and more.” – Eric Tassone and Farzan Rohani say.
By averaging the forecast of many models that perform differently in different time series situations, they achieved better predictability than they could with a single model. While some models work better with their specific non-stationary data, others shine in theirs. The average that they yield acts like an expert opinion and turns out to be very precise.
However, the authors of the post note that this approach may be the best one for their specific situation. Google services stretch across many countries where different factors like electricity, internet speed, user working cycles are adding too many non-stationary patterns. So, if you aren’t operating with a multitude of locations or a large set of varying data sources, ensemble models may not be for you. But if you track time-series patterns across countries or business units in different regions it might be the best fit.
Tools and services used for time series forecasting
We published an overview of MLaaS platforms for semi and fully automated machine learning tasks that can be approached by organizations with limited access to data science and analytics talent.
The problem with automation in prediction and machine learning operations is that the technologies are still in their infancy. Fully automated solutions suffer from the lack of flexibility as they perform many operations under the hood and can either do straightforward and general tasks (like object recognition on pictures) or fail to capture business specifics. On the other hand, hiring full-blown data science teams may be cost-sensitive in the early stages of your analytics initiative. A happy medium here are instruments like TensorFlow, that still require some engineering talent on board but provide enough automation and convenient tools to avoid reinventing the wheel.
Facebook’s Prophet
The great contributor to the operationalization of time series prediction is Prophet, one of the most popular open-source products from Facebook with an epic name. Facebook has been quite generous in open sourcing the tools they use, remember React Native that was released for public use in 2013. But this time they give away a pretty task-specific package.
Prophet is positioned as “Forecasting at Scale”, which according to the authors means mainly 3 things:
1. A broad variety of people can use the package. Potential users are both data scientists and people who have the domain knowledge to configure data sources and integrate Prophet into their analytics infrastructures. You can operate Prophet with R and Python, the two most common programming languages applied for data science tasks.
2. A broad variety of problems can be addressed. Facebook used the tool for social media time series forecasting, but the model is configurable to match various business circumstances. Not only does Prophet work well with data having pronounced seasonality, it can also automatically adjust to trend changes.
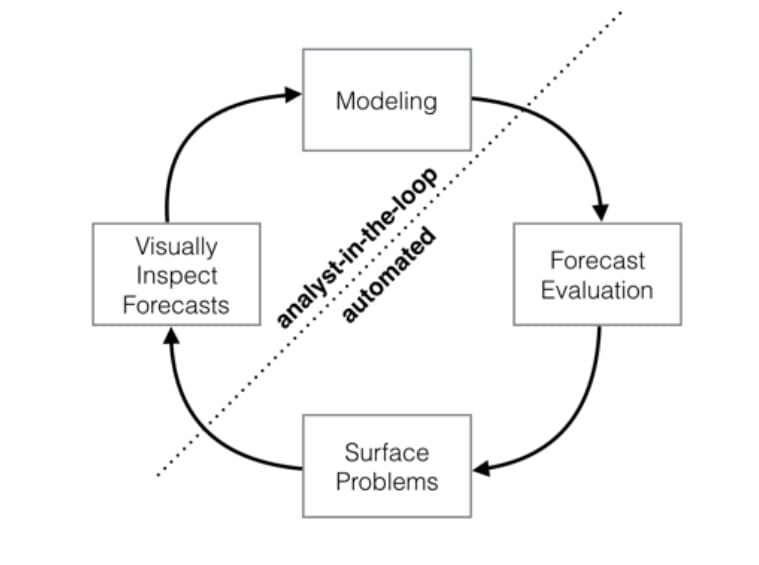
3. Performance evaluation is automated. Here comes the sweetest part. Evaluation and a number of surface problems are automated and human analysts just have to visually inspect forecasts, do the modeling, and react to situations when the machine thinks that forecasts have a high error probability.
Modeling, in this case, means that analysts use their domain knowledge and external data to tweak the work of Prophet. For instance, you can input market size data or other capacities information to let the algorithm consider these factors and adjust to them. As you know when you are going to roll out some game-changing updates, like a site redesign or some mind-blowing feature, you can also signal the algorithm about these. And eventually, you can define the relevant scale of seasonality and even add holidays as recurring patterns in your time series. All retailers know how different the Black Friday or Christmas are from the rest of the year.
Google’s TensorFlow, BigQuery, and Vertex AI
Google has a robust and rich set of cloud services with various machine learning capabilities right out of the box. If you stick with Google, you can either use automated tools or go custom to better tailor its toolset to unique business needs. There are three main tools to access time-series capabilities that Google suggests.
TensorFlow. TensorFlow is a popular all-purpose machine learning framework that works specifically with neural networks. It’s also an open-source tool geared toward data scientists and ML engineers, who can either use its out-of-the-box capabilities or go deeper and customize the models running under the hood. TensorFlow can be used as a standalone tool to train models and deploy them wherever you need, but it’s also well integrated with Google’s cloud infrastructure.
BigQuery and Vertex AI. If you’re using the Google Cloud platform, you may access time series forecasting with its autoML tool called Vertex AI. It comes with pre-configured models with customization tools. In its core, Vertex AI leverages TensorFlow capabilities but requires far less data science expertise to operate, catering to average software engineers.
On top of that, you can explore, visualize, and prepare data for time series tasks using Google’s cloud data warehousing tool BigQuery as it comes integrated with Vertex AI.
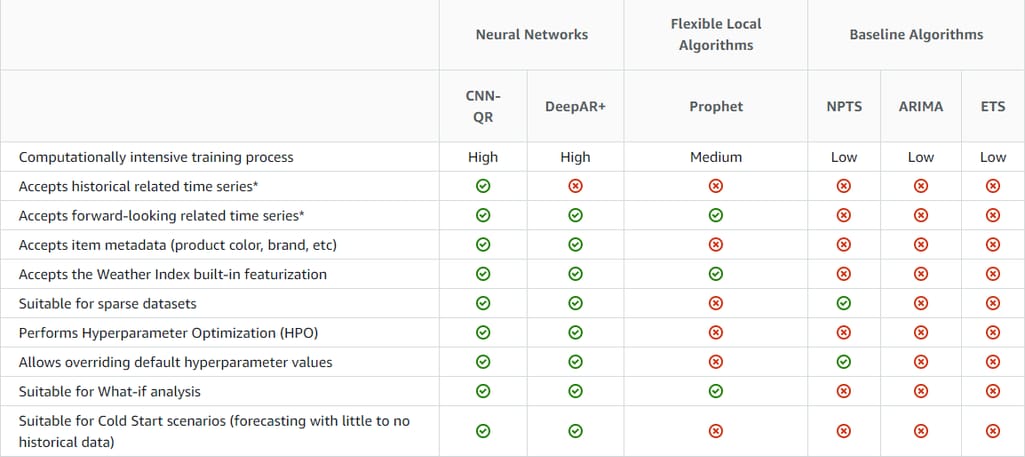
Amazon Forecast is another managed tool to run time series forecasting with AWS. The system is capable of automatically analyzing data, finding key variables in it, and choosing the best-fit algorithm to apply. However, if you have enough data science experience, you can select from six built-in algorithms depending on your specific needs.
Amazon time series forecasting algorithms, compare. Source: AWS
The algorithms differ in terms of their capabilities and computational intensity, which will directly impact the cost. They range from more powerful convolutional neural networks to more conventional methods such as ARIMA and ETS.
Azure Time Series Insights for IoT Data
Finally, let’s mention the tool by Microsoft, Time Series Insights, designed solely to support time series analysis but not forecasting. The insights solution is focused on IoT streaming data, which means it can capture and visualize insights at scale with billions of events streamed into the system over seconds.
Insights come pre-integrated with Azure infrastructure, in particular, with IoT Hub and Events Hub. The cloud service allows you to store JSON and CSV data for as long as 400 days, query it, and visualize it.
Time series forecasting will become more automated in the future
Both time series automation and the growth of available data from endpoint devices define the main trend in time series forecasting. Analytics are becoming increasingly more affordable and eventually more critical for business success. Not only can we track business progress, but we also, can capture very specific non-stationary and sometimes time-dependent events that were missing before. And the emerging power of intermediary services allows a wider group of professionals without data science expertise to leverage time series forecasts.